Countries With the Best Environmental Records
https://www.humantruth.info/best_country_for_environment.html
By Vexen Crabtree 2025
#bhutan #climate_change #environmentalism #equatorial_guinea #haiti #iceland #internationalism #iran #libya #switzerland #the_environment #turkmenistan #united_arab_emirates #USA #yemen
We have known for a long term that we must protect the environment from habitation destruction, over-exploitation, pollution, and the emissions that cause climate change. In 1998, Greenpeace wrote that "Environment can no longer be meaningfully separated from health, quality of life, democracy, education, economy or trade"1. What countries have been doing the right thing, via legislation and national culture? All countries' current and historical approach towards the environment is gauged via 21 datasets, including multiple decades of data on its forested percent change 2000-2020, its environmental performance, energy to GDP efficiency, its sign-up rate to major international accords on protecting the environment, the rate of rational beliefs on the environment in the population, reducing annual meat consumption per person and its score on the Green Future Index.
The countries that do the best (Sri Lanka, Uruguay and Switzerland) tend to have avoided the excesses of early industrial countries, and have not yet repeated the same mistakes of environmental destruction - at least, not on the same scale. The regions with the best average results per country are Central America, South America and Scandinavia. The worst are Eritrea, The Vatican City and Timor-Leste (E. Timor), and the worst regions Micronesia, Australasia and Melanesia.
The interesting portion is the middle-range countries; there is heavy competition on efficiency, sustainable planning, and environmental wisdom given the high energy demands of well-developed countries as judged by GDP. All results go towards the overall SAMDI (Social and Moral Development Index).
- The Criteria: The Environment
- Overall Results by Country
- Overall Results by Region
- The Social and Moral Development Index
- Links
1. The Criteria: The Environment
1.1. Forest Area Change 2000-2020
#2000s #2010s #biodiversity #deforestation #environmentalism #forests #over-exploitation #the_environment
| Forest Area Change 2000-2020 Higher is better2 | ||||
|---|---|---|---|---|
| Pos. | Total2 | 2010s | 2000s | |
| 1 | Guernsey | 82.6% | 0.0% | 82.6% |
| 2 | Bahrain | 75.2% | 34.6% | 40.5% |
| 3 | Iceland | 64.7% | 15.0% | 49.7% |
| 4 | Burundi | 44.2% | 44.2% | 0.0% |
| 5 | Uruguay | 43.8% | 17.3% | 26.5% |
| 6 | Montenegro | 32.1% | 0.0% | 32.1% |
| 7 | Malta | 31.4% | 31.4% | 0.0% |
| 8 | Cuba | 31.0% | 10.6% | 20.4% |
| 9 | Kuwait | 28.9% | 0.0% | 28.9% |
| 10 | Uzbekistan | 23.3% | 10.2% | 13.1% |
| 11 | Algeria | 23.1% | 1.6% | 21.5% |
| 12 | China | 23.0% | 9.7% | 13.3% |
| 13 | Vietnam | 23.0% | 9.4% | 13.6% |
| 14 | Ireland | 22.8% | 8.6% | 14.3% |
| 15 | Syria | 20.0% | 6.1% | 13.9% |
| 16 | Guam | 16.7% | 16.7% | 0.0% |
| 17 | Puerto Rico | 15.5% | 1.0% | 14.5% |
| 18 | Iran | 15.2% | 0.6% | 14.7% |
| 19 | Bulgaria | 14.9% | 4.2% | 10.7% |
| 20 | Chile | 14.6% | 8.9% | 5.7% |
| q=234. | ||||
| Forest Area Change 2000-2020 Higher is better2 | ||||
|---|---|---|---|---|
| Pos. | Total2 | 2010s | 2000s | |
| 234 | Ivory Coast | -50.6% | -28.5% | -22.2% |
| 233 | Nicaragua | -41.1% | -18.6% | -22.4% |
| 232 | Gambia | -35.2% | -19.1% | -16.0% |
| 231 | Chad | -35.0% | -22.0% | -13.0% |
| 230 | Paraguay | -32.6% | -17.7% | -14.9% |
| 229 | Malawi | -29.4% | -15.8% | -13.6% |
| 228 | St Pierre & Miquelon | -29.1% | -15.3% | -13.8% |
| 227 | Uganda | -28.0% | -15.0% | -13.0% |
| 226 | Mauritania | -27.7% | -14.8% | -12.9% |
| 225 | Benin | -25.8% | -13.8% | -12.1% |
| 224 | Cambodia | -25.6% | -23.8% | -1.8% |
| 223 | Northern Mariana Islands | -24.8% | -19.7% | -5.1% |
| 222 | Comoros | -22.3% | -11.7% | -10.5% |
| 221 | Somalia | -21.6% | -11.4% | -10.2% |
| 220 | Egypt | -20.6% | -31.5% | 10.9% |
| 219 | Niger | -19.7% | -10.3% | -9.4% |
| 218 | Myanmar | -19.0% | -9.2% | -9.8% |
| 217 | Namibia | -18.5% | -9.7% | -8.8% |
| 216 | Pakistan | -18.2% | -9.0% | -9.3% |
| 215 | Guatemala | -16.8% | -5.2% | -11.6% |
| q=234. | ||||
Forests are carbon sinks, mitigating against climate change3,4. Unfortunately, we are destroying over 70,000 km2 of forest each year5. In the last few thousand years, we've removed 30-40% of the Earth's forest cover6,4, mostly to clear space for agriculture, and for logging7,8. The produce from both is shipped from poorer countries to richer ones. Half-hearted government efforts and company obfuscation of supply chains makes it almost impossible for consumers to tell which foods and products are from sustainable sources, and which ones are encouraging irresponsible deforestation, meaning that there is little incentive for companies to relent.
The effects are catastrophic. 15% of all greenhouse gas emissions are the result of deforestation9,7. It brings soil erosion from wind and rain which, over time, can almost-permanently stop any hope of growing food10, and spreads desertification. Entire ecosystems are collapsing as a result, including ones that we depend upon11. The water cycle is driven by forests, and their loss reduces ordinary rainfall, increases flooding, removes an abundant source of water filtration, and contributes to a rise in water levels.12.
Some regions of the world are increasing their forest cover4; the best from 2000-2020 are Scandinavia (13.8% ), The Balkans (11.0% ) and Baltic States (7.6% )2. There is an overall trend that developed countries gathered their riches by using up their natural resources, and now, they pay poorer countries to use up theirs instead, whilst they can afford to slowly rebuild their natural environments. But it's not wholly that simple - some rich regions are still burning through what they've got. The regions clearing their forests fastest are Central America (-12.8% ), Africa (-9.1% ) and North America (-2.9% )2.
For more, see:
Forest Area Change 2000-2020 By Global Region:
| Area | Forest Area Change 2000-2020 Higher is better2 | 2010s | 2000s | |
|---|---|---|---|---|
| Africa... | -8.7% | -4.5% | -4.2% | |
| Asia... | 3.2% | 0.5% | 2.7% | |
| Australasia | 0.1% | 0.2% | -0.1% | |
| Europe... | 8.2% | 2.5% | 5.7% | |
| North America | -2.0% | -1.0% | -1.0% | |
| South America | -2.5% | -1.3% | -1.2% | |
| The Middle East... | 7.2% | -0.3% | 7.5% | |
| World | -0.1% | -0.7% | 0.6% | |
Note that these are values for the average country, not averages by total regional population.
1.2. Environmental Performance
#climate_change #the_environment
| Environmental Performance Higher is better13 | ||
|---|---|---|
| Pos. | 201813 | |
| 1 | Switzerland | 87.4 |
| 2 | France | 84.0 |
| 3 | Denmark | 81.6 |
| 4 | Malta | 80.9 |
| 5 | Sweden | 80.5 |
| 6 | UK | 79.9 |
| 7 | Luxembourg | 79.1 |
| 8 | Austria | 79.0 |
| 9 | Ireland | 78.8 |
| 10 | Finland | 78.6 |
| 11 | Iceland | 78.6 |
| 12 | Spain | 78.4 |
| 13 | Germany | 78.4 |
| 14 | Norway | 77.5 |
| 15 | Belgium | 77.4 |
| 16 | Italy | 77.0 |
| 17 | New Zealand | 76.0 |
| 18 | Netherlands | 75.5 |
| 19 | Israel | 75.0 |
| 20 | Japan | 74.7 |
| q=180. | ||
| Environmental Performance Higher is better13 | ||
|---|---|---|
| Pos. | 201813 | |
| 180 | Burundi | 27.4 |
| 179 | Bangladesh | 29.6 |
| 178 | Congo, DR | 30.4 |
| 177 | India | 30.6 |
| 176 | Nepal | 31.4 |
| 175 | Madagascar | 33.7 |
| 174 | Haiti | 33.7 |
| 173 | Lesotho | 33.8 |
| 172 | Niger | 35.7 |
| 171 | Central African Rep. | 36.4 |
| 170 | Angola | 37.4 |
| 169 | Pakistan | 37.5 |
| 168 | Afghanistan | 37.7 |
| 167 | Benin | 38.2 |
| 166 | Mauritania | 39.2 |
| 165 | Eritrea | 39.3 |
| 164 | Papua New Guinea | 39.4 |
| 163 | Djibouti | 40.0 |
| 162 | Swaziland | 40.3 |
| 161 | Cameroon | 40.8 |
| q=180. | ||
The Environmental Performance Index 2018 data includes 24 indicators including air pollution, water and sanitation, biodiversity, ecosystems and environmental health, combined into a single score by country, by the Yale University Center for Environmental Law & Policy.
The worst countries on this scale (in 2018) generally use massive quantities of natural resources in an unsustainable manner and have populations that are rising quickly. Turkmenistan and United Arab Emirates have only a tiny percentage of their primary energy supply sourced from renewables (both under 0.03%). Equatorial Guinea saw its CO2 emissions per person rise by 11% between 1970-2008, the second highest in the world after Bhutan. Incredibly for an island, under 13% of those in Haiti believe that human activity is causing global warming, whilst only 29% believe it in United Arab Emirates and Turkmenistan.
The best countries are not better in all criteria but normally excel in a few categories. Iceland produces 82% of its primary energy supply through renewable sources. Its CO2 emissions per person rose only by 0.1 percent. It more than doubled its forested area between 1990 and 2008. Switzerland reduced its CO2 emissions per person by 0.5% and also increased its forested areas.
Environmental Performance By Global Region:
| Environmental Performance (2018)13 | ||
|---|---|---|
| Area | Higher is better13 | |
| Africa... | 46.4 | |
| Asia... | 54.5 | |
| Australasia | 55.2 | |
| Europe... | 69.6 | |
| North America | 58.9 | |
| South America | 58.6 | |
| The Middle East... | 60.0 | |
| World | 56.4 | |
Note that these are values for the average country, not averages by total regional population.
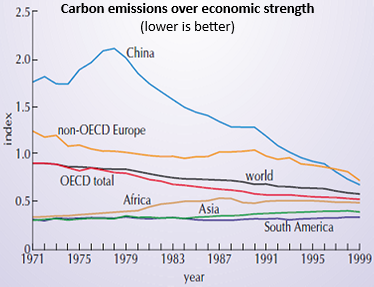
Source: Peake & Smith (2009)14
The overall picture is of gradually increasing efficiency: we are getting better at generating income for the emissions we cause. However, this is still a hundred times to small to account for increases in population and increasing average wealth. In other words, a billion people have been pulled out of poverty, leading to an immense increase in consumed goods and resources. It might be more efficient, but, the overall output is still increasing due to growing material capability and increasing population.
1.3. Energy to GDP Efficiency
| Energy to GDP Efficiency Lower is better15 | ||||||||
|---|---|---|---|---|---|---|---|---|
| Pos. | 2022 Avg15 | 2010s Avg | 2000s Avg | 1990s Avg | 1980s Avg | 1970s Avg | 1960s Avg | |
| 1 | Rwanda | 0.25 | 0.26 | 0.28 | 0.49 | 0.27 | ||
| 2 | Chad | 0.26 | 0.20 | 0.11 | 0.21 | 0.31 | ||
| 3 | Tanzania | 0.31 | 0.39 | 0.45 | 0.56 | 0.69 | ||
| 4 | Uganda | 0.37 | 0.36 | 0.33 | 0.35 | 0.32 | ||
| 5 | Sierra Leone | 0.37 | 0.44 | 0.46 | 0.80 | 0.60 | ||
| 6 | Malawi | 0.37 | 0.48 | 0.57 | 0.61 | 0.53 | ||
| 7 | Madagascar | 0.38 | 0.46 | 0.42 | 0.39 | 0.41 | ||
| 8 | Sri Lanka | 0.39 | 0.38 | 0.44 | 0.45 | 0.48 | 0.61 | 0.43 |
| 9 | Burundi | 0.41 | 0.32 | 0.26 | 0.35 | 0.16 | ||
| 10 | Central African Rep. | 0.41 | 0.38 | 0.37 | 0.42 | 0.35 | ||
| 11 | Ethiopia | 0.42 | 0.46 | 0.44 | 0.34 | 0.29 | ||
| 12 | Afghanistan | 0.43 | 0.55 | 0.35 | 0.93 | 1.01 | ||
| 13 | Guinea-Bissau | 0.45 | 0.63 | 0.74 | 0.90 | 0.52 | ||
| 14 | Niger | 0.48 | 0.57 | 0.42 | 0.57 | 0.41 | ||
| 15 | Congo, DR | 0.49 | 0.58 | 0.87 | 1.13 | 0.95 | ||
| 16 | Nigeria | 0.49 | 0.43 | 0.63 | 1.15 | 1.17 | ||
| 17 | Myanmar | 0.53 | 0.46 | 0.48 | 0.54 | 0.49 | ||
| 18 | Gabon | 0.55 | 0.62 | 0.80 | 1.36 | 1.56 | ||
| 19 | Switzerland | 0.55 | 0.68 | 0.98 | 1.36 | 1.64 | 1.68 | 1.63 |
| 20 | Nepal | 0.55 | 0.48 | 0.38 | 0.28 | 0.18 | ||
| q=165. | ||||||||
| Energy to GDP Efficiency Lower is better15 | ||||||||
|---|---|---|---|---|---|---|---|---|
| Pos. | 2022 Avg15 | 2010s Avg | 2000s Avg | 1990s Avg | 1980s Avg | 1970s Avg | 1960s Avg | |
| 165 | Turkmenistan | 4.69 | 3.46 | 4.71 | 8.70 | 8.12 | ||
| 164 | Trinidad & Tobago | 4.64 | 5.11 | 5.10 | 4.55 | 2.96 | 3.58 | 3.31 |
| 163 | Bahrain | 4.19 | 4.00 | 7.13 | 15.59 | 19.77 | ||
| 162 | Venezuela | 4.18 | 2.27 | 2.29 | 2.26 | 2.13 | 1.46 | 1.47 |
| 161 | Iceland | 4.01 | 4.58 | 3.67 | 3.20 | 2.92 | 3.27 | 2.84 |
| 160 | Laos | 2.75 | 1.95 | 0.83 | 0.48 | 0.63 | ||
| 159 | N. Korea | 2.46 | 2.87 | 6.50 | 6.82 | |||
| 158 | Mozambique | 2.38 | 2.93 | 2.10 | 0.39 | 0.65 | ||
| 157 | Malta | 2.36 | 2.55 | 2.52 | 1.67 | 1.65 | ||
| 156 | Canada | 2.29 | 2.56 | 2.94 | 3.60 | 3.97 | 4.39 | 4.21 |
| 155 | Oman | 2.28 | 2.03 | 1.84 | 2.07 | 2.11 | 2.44 | 0.17 |
| 154 | Russia | 2.25 | 2.34 | 3.47 | 5.76 | 5.40 | 4.44 | 4.12 |
| 153 | Iran | 2.24 | 2.02 | 2.16 | 2.35 | 1.95 | 1.03 | 0.86 |
| 152 | Kyrgyzstan | 2.20 | 2.71 | 3.44 | 4.53 | |||
| 151 | Syria | 2.12 | 2.07 | 2.00 | 1.40 | 1.06 | ||
| 150 | Ukraine | 2.11 | 2.70 | 4.32 | 6.69 | 5.68 | ||
| 149 | Lebanon | 2.06 | 1.35 | 1.78 | 2.58 | 2.19 | ||
| 148 | Singapore | 2.06 | 2.36 | 2.88 | 3.49 | 3.35 | 4.55 | 6.85 |
| 147 | Libya | 2.05 | 1.83 | 2.70 | 5.16 | 5.91 | ||
| 146 | Barbados | 2.04 | 2.04 | 2.09 | 1.80 | 1.53 | ||
| q=165. | ||||||||
GDP per unit of energy consumption is often called 'Energy Intensity'. It's how efficient countries are at producing GDP in terms of primary energy use. It represents primary energy consumption using the substitution method, per unit of gross domestic product (GDP). A lower value means that less energy was used to maintain the country's GDP.
High values could mean that a country wastes little energy, and low values could mean that they use a lot of energy for little gain. However, some countries could be engaged heavily in endeavours that are worthwhile, but, which do not generate GDP. However, in general, it is still good to measure energy-to-GDP efficiency as it is likely that if they do so efficiently, the national as a whole is also likely to be using energy efficiently in general. This is a proxy method for measuring that, made useful by the long history of GDP data that is available.
Our World in Data16 correlated and processed data from 3 sources: (1) U.S. Energy Information Administration (2023), (2) Energy Institute - Statistical Review of World Energy (2024) and (3) Bolt and van Zanden - Maddison Project Database 2023.
Energy to GDP Efficiency By Global Region:
| Area | Energy to GDP Efficiency (2022) Lower is better Avg15 | 2010s Avg | 2000s Avg | 1990s Avg | 1980s Avg | 1970s Avg | 1960s Avg | |
|---|---|---|---|---|---|---|---|---|
| Africa... | 0.83 | 0.88 | 0.97 | 1.18 | 1.17 | 1.61 | 1.48 | |
| Asia... | 1.50 | 1.52 | 2.04 | 3.18 | 2.99 | 1.67 | 1.68 | |
| Australasia | 1.23 | 1.49 | 1.80 | 2.26 | 2.27 | 2.29 | 2.12 | |
| Europe... | 1.25 | 1.44 | 1.83 | 2.51 | 2.83 | 2.77 | 2.58 | |
| North America | 1.40 | 1.46 | 1.68 | 1.76 | 1.70 | 3.17 | 3.03 | |
| South America | 1.45 | 1.35 | 1.52 | 1.55 | 1.23 | 1.09 | 1.09 | |
| The Middle East... | 1.60 | 1.57 | 2.10 | 3.87 | 3.89 | 1.71 | 1.56 | |
| World | 1.23 | 1.30 | 1.60 | 2.15 | 2.10 | 2.13 | 2.05 | |
Note that these are values for the average country, not averages by total regional population.
1.4. International Accords on the Environment
#environmentalism #internationalism
| International Accords on the Environment Higher is better | ||||||||
|---|---|---|---|---|---|---|---|---|
| Pos. | International Accords on the Environment Avg Rate | 2020s (so far) Rate | 2010s Rate | 2000s Rate | 1990s Rate | 1980s Rate | 1970s Rate | |
| 1 | Sweden | 83% | 100% | 99% | 91% | 71% | 91% | 45% |
| 2 | Canada | 82% | 100% | 88% | 93% | 70% | 95% | 47% |
| 3 | Norway | 81% | 100% | 99% | 93% | 71% | 93% | 32% |
| 4 | Latvia | 81% | 100% | 97% | 88% | 40% | ||
| 5 | Estonia | 80% | 100% | 98% | 78% | 45% | ||
| 6 | Ukraine | 80% | 100% | 99% | 81% | 40% | ||
| 7 | Finland | 79% | 100% | 98% | 90% | 69% | 83% | 34% |
| 8 | Georgia | 79% | 100% | 97% | 83% | 35% | ||
| 9 | Switzerland | 78% | 100% | 96% | 90% | 69% | 72% | 45% |
| 10 | Nigeria | 78% | 100% | 97% | 88% | 69% | 66% | 45% |
| 11 | Germany | 76% | 100% | 99% | 94% | 65% | 65% | 35% |
| 12 | Belarus | 76% | 90% | 88% | 76% | 49% | ||
| 13 | Lithuania | 75% | 100% | 98% | 80% | 24% | ||
| 14 | Australia | 74% | 100% | 98% | 82% | 67% | 66% | 32% |
| 15 | Uruguay | 74% | 100% | 99% | 91% | 70% | 41% | 45% |
| 16 | Macedonia | 74% | 100% | 94% | 76% | 25% | ||
| 17 | Panama | 74% | 100% | 99% | 97% | 77% | 57% | 11% |
| 18 | Denmark | 73% | 100% | 98% | 88% | 67% | 65% | 22% |
| 19 | Ecuador | 72% | 100% | 96% | 90% | 69% | 33% | 45% |
| 20 | Armenia | 72% | 100% | 97% | 76% | 15% | ||
| q=197. | ||||||||
| International Accords on the Environment Higher is better | ||||||||
|---|---|---|---|---|---|---|---|---|
| Pos. | International Accords on the Environment Avg Rate | 2020s (so far) Rate | 2010s Rate | 2000s Rate | 1990s Rate | 1980s Rate | 1970s Rate | |
| 197 | Vatican City | 10% | 31% | 22% | 4% | 0% | 0% | 0% |
| 196 | Palestine | 19% | 88% | 28% | 0% | 0% | 0% | 0% |
| 195 | Andorra | 22% | 70% | 47% | 15% | 0% | 0% | 0% |
| 194 | Haiti | 25% | 50% | 52% | 43% | 7% | 0% | 0% |
| 193 | San Marino | 26% | 67% | 59% | 19% | 12% | 0% | 0% |
| 192 | Iraq | 28% | 96% | 67% | 5% | 0% | 0% | 0% |
| 191 | Angola | 33% | 86% | 65% | 45% | 4% | 0% | 0% |
| 190 | Palau | 34% | 78% | 76% | 47% | 2% | 0% | 0% |
| 189 | Bhutan | 35% | 75% | 74% | 53% | 10% | 0% | 0% |
| 188 | Timor-Leste (E. Timor) | 36% | 50% | 52% | 6% | |||
| 187 | S. Sudan | 37% | 47% | 27% | ||||
| 186 | Nauru | 39% | 75% | 78% | 64% | 14% | 0% | 0% |
| 185 | Brunei | 39% | 75% | 77% | 48% | 36% | 0% | 0% |
| 184 | Sao Tome & Principe | 40% | 100% | 90% | 51% | 0% | 0% | 0% |
| 183 | Tuvalu | 40% | 86% | 70% | 58% | 27% | 0% | 0% |
| 182 | Afghanistan | 41% | 100% | 81% | 35% | 14% | 13% | 0% |
| 181 | Grenada | 41% | 87% | 67% | 59% | 32% | 0% | 0% |
| 180 | Serbia | 41% | 100% | 96% | 52% | 0% | 0% | 0% |
| 179 | Marshall Islands | 42% | 78% | 80% | 65% | 30% | 0% | 0% |
| 178 | Solomon Islands | 42% | 83% | 79% | 62% | 28% | 0% | 0% |
| q=197. | ||||||||
Each country is scored using a formula that takes the date each country took up major international environmental agreements, as a ratio of maximum possible days. The agreements covered are: (1) the Basel Convention on the Control of Transboundary Movements of Hazardous Wastes and their Disposal, (2) the Rotterdam Convention on the Prior Informed Consent Procedure for certain hazardous Chemicals and Pesticides, (3) the Stockholm Convention on Persistent Organic Pollutants, (4) the Waigani Convention (for those countries that are eligible), (5) the Convention on Biological Diversity (CBD), (6) the Kyoto Protocol and (7) its successor, the Paris Agreement, (8) the Convention on International Trade in Endangered Species of Wild Fauna and Flora (CITES), (9) the Montreal Protocol on Substances that Deplete the Ozone Layer and finally, (10) the Vienna Convention for the Protection of the Ozone Layer.
For more, see:
Each country is scored using a formula that takes the date each country took up major international environmental agreements, as a ratio of maximum possible days. The agreements covered are: (1) the Basel Convention on the Control of Transboundary Movements of Hazardous Wastes and their Disposal, (2) the Rotterdam Convention on the Prior Informed Consent Procedure for certain hazardous Chemicals and Pesticides, (3) the Stockholm Convention on Persistent Organic Pollutants, (4) the Waigani Convention (for those countries that are eligible), (5) the Convention on Biological Diversity (CBD), (6) the Kyoto Protocol and (7) its successor, the Paris Agreement, (8) the Convention on International Trade in Endangered Species of Wild Fauna and Flora (CITES), (9) the Montreal Protocol on Substances that Deplete the Ozone Layer and finally, (10) the Vienna Convention for the Protection of the Ozone Layer. Each is described beneath the table of results.
Even if slow, once a country has signed up, it will get full marks in future decades. Hence, scores tend to go up. These accords tend to be approached most keenly by those who are due to lose the most (small islands, for example). So, it is noteworthy to spot rich countries who are out-performing their peers. Those countries, by signing up earlier, encourage the others to follow suit, and by gaining points, rise above their peers on the Social and Moral Development Index.
Signing up early to these encourages others to engage with them seriously, and sends messages to populations and corporations that destructive behaviour must change. Being slow to sign up for these creates doubt, discourages others, and allow corporations to engage in abuses for longer. The scores for each country are a ratio: 1 is the best result, meaning a country had no delay in ratifying any of the major agreements for the betterment of the environment. Over time, most countries get better, as they eventually sign up for most accords. The competition is in the speed of uptake for new treaties, and then, remaining a member with no lapses.
Here are more details on each accord:
The Basel Convention on the Control of Transboundary Movements of Hazardous Wastes and their Disposal, adopted in 1989 and in force since 1992, is one of a trio of global treaties aimed at protecting human health and the environment from the dangers of hazardous waste. The other two are the Rotterdam Convention on the Prior Informed Consent Procedure for certain hazardous Chemicals and Pesticides and the Stockholm Convention on Persistent Organic Pollutants. If Basel's instruction is "don't dump it", then Rotterdam's is "don't ship it without asking" and Stockholm's is "avoid producing it at all wherever possible". This trio helps manage the movement of waste between countries, especially from developed to developing countries, promoting environmentally sound management. Together they require prior informed consent from transit countries before waste shipments can proceed, encourage waste minimization and local disposal whenever possible, and aim to protect the environment from highly dangerous, long-lasting chemicals by restricting and ultimately eliminating their production, use, trade, release and storage.17
The Waigani Convention is an extension of Basel, and, is used in particular to apply it South Pacific nations who face unique challenges, such as illegal dumping by companies from richer countries who see the area as harder to monitor.
National dates of notification: https://treaties.un.org/Pages/showDetails.aspx?objid=0800000280087d5c for Waigani signatory notification dates.The Convention on Biological Diversity (CBD) derived from United Nations activity in the 1980s following rising scientific alarm over the impact of human activity on natural habitats and a rising awareness of resultant extinctions and disruptive shifts in ecosystems that is difficult (or impossible) to reverse. CBD was launched at the Rio Earth Summit in 1992, and received 168 signatures over the subsequent year. A large number of small island nations were early adopters: they are uniquely susceptible to over-exploitation by rich companies and countries, but simultaneously, are the least responsible for driving global extinctions.18
The Kyoto Protocol was adopted in 1997 that committed 37 industrialized countries and the EU to reduce greenhouse gas emissions by an average of 5% below 1990 levels between 2008-2012. It was the first legally binding agreement to tackle climate change, recognizing that developed nations bear greater responsibility for current emissions. It introduced market-based mechanisms - emissions trading and the Clean Development Mechanism - to help countries meet targets. The refusal of the USA to join was the biggest setback humanity had faced so far in its struggle to curb harmful human behaviour. A second commitment period, known as the Doha Amendment, extended obligations through 2020, though with fewer participating countries.
The Paris Agreement was adopted in December 2015 during the UN Climate Change Conference (COP21) in Paris and entered into force in November 2016. It aims to limit global warming to well below 2°C above pre-industrial levels and pursue efforts to limit it to 1.5°C. This is a minimum-effort agreement, under which countries set their own goals; the standard is low enough that even the USA signed it, although progress has reverted and its commitments deleted during Trump's time as President. Also, Iran, Libya and Yemen signed it in 2016, but never ratified it into law.
The Convention on International Trade in Endangered Species of Wild Fauna and Flora (CITES) is an international agreement between governments. Its aim is to ensure that international trade in specimens of wild animals and plants does not threaten the survival of the species. The date used for scoring is the date the country brought CITES into force nationally.19
Vienna Convention for the Protection of the Ozone Layer (adopted in 1985) and the The Montreal Protocol on Substances that Deplete the Ozone Layer (adopted in 1987); the first is about sharing science and data, and the latter is a legally binding treaty that sets specific targets to phase out ozone-depleting substances (ODS) like CFCs and halons.20
International Accords on the Environment By Global Region:
| Area | International Accords on the Environment Higher is better Avg Rate | 2020s (so far) Rate | 2010s Rate | 2000s Rate | 1990s Rate | 1980s Rate | 1970s Rate | |
|---|---|---|---|---|---|---|---|---|
| Africa... | 56.4% | 97.2% | 92.9% | 75.4% | 42.4% | 21.3% | 9.3% | |
| Asia... | 55.4% | 94.2% | 88.4% | 69.6% | 40.9% | 16.6% | 5.6% | |
| Australasia | 48.2% | 86.8% | 84.2% | 68.6% | 35.6% | 9.9% | 4.4% | |
| Europe... | 62.7% | 95.6% | 91.9% | 76.5% | 46.9% | 33.5% | 8.4% | |
| North America | 57.7% | 93.6% | 89.6% | 77.6% | 53.0% | 25.0% | 7.5% | |
| South America | 66.5% | 100.0% | 96.9% | 83.7% | 58.1% | 35.8% | 24.7% | |
| The Middle East... | 51.5% | 95.1% | 85.7% | 67.5% | 41.4% | 13.4% | 6.0% | |
| World | 57.5% | 95.0% | 90.7% | 74.4% | 45.0% | 23.3% | 8.5% | |
Note that these are values for the average country, not averages by total regional population.
1.5. Rational Beliefs on the Environment
| Rational Beliefs on the Environment Higher is better21 | ||
|---|---|---|
| Pos. | 2011 %21 | |
| 1 | Argentina | 78.3% |
| 2 | Greece | 77.6% |
| 3 | Brazil | 77.1% |
| 4 | Trinidad & Tobago | 74.5% |
| 5 | Costa Rica | 74.2% |
| 6 | Cyprus | 71.0% |
| 7 | Guatemala | 70.9% |
| 8 | Philippines | 70.8% |
| 9 | S. Korea | 70.7% |
| 10 | Colombia | 70.3% |
| 11 | Bolivia | 69.3% |
| 12 | Paraguay | 68.9% |
| 13 | Mexico | 67.0% |
| 14 | Nicaragua | 67.0% |
| 15 | El Salvador | 66.8% |
| 16 | Indonesia | 66.5% |
| 17 | Japan | 64.7% |
| 18 | Panama | 64.6% |
| 19 | Peru | 63.9% |
| 20 | Chile | 63.8% |
| q=145. | ||
| Rational Beliefs on the Environment Higher is better21 | ||
|---|---|---|
| Pos. | 2011 %21 | |
| 145 | Turkmenistan | 8.6% |
| 144 | Albania | 9.4% |
| 143 | Haiti | 10.0% |
| 142 | Tajikistan | 11.1% |
| 141 | Uzbekistan | 11.3% |
| 140 | Iceland | 13.1% |
| 139 | Libya | 14.6% |
| 138 | Denmark | 14.9% |
| 137 | China | 15.1% |
| 136 | Estonia | 15.9% |
| 135 | Czechia | 16.0% |
| 134 | Tunisia | 19.3% |
| 133 | Latvia | 19.5% |
| 132 | Zimbabwe | 19.6% |
| 131 | Kuwait | 19.6% |
| 130 | USA | 19.7% |
| 129 | Botswana | 20.4% |
| 128 | Norway | 20.5% |
| 127 | UAE | 20.8% |
| 126 | Malawi | 22.0% |
| q=145. | ||
Rational Beliefs on the Environment By Global Region:
| Rational Beliefs on the Environment (2011)21 | ||
|---|---|---|
| Area | Higher is better %21 | |
| Africa... | 38.3% | |
| Asia... | 37.9% | |
| Australasia | 28.0% | |
| Europe... | 33.6% | |
| North America | 54.2% | |
| South America | 63.8% | |
| The Middle East... | 35.1% | |
| World | 39.9% | |
Note that these are values for the average country, not averages by total regional population.
1.6. Meat Consumption
#animal_rights #animal_welfare #diet #food #health #meat #veganism #vegetarianism
| Meat Consumption Lower is better22 | |||
|---|---|---|---|
| Pos. | 2021 kg22 | 2010s Avg22 | |
| 1 | Congo, DR | 03.0 | 03.7 |
| 2 | Burundi | 03.5 | 02.7 |
| 3 | Bangladesh | 04.3 | 04.1 |
| 4 | Madagascar | 05.4 | 06.7 |
| 5 | India | 05.7 | 04.3 |
| 6 | Nigeria | 07.0 | 07.9 |
| 7 | Ethiopia | 07.1 | 06.9 |
| 8 | Rwanda | 07.6 | 08.5 |
| 9 | Mali | 07.8 | 21.5 |
| 10 | Niger | 08.1 | 09.1 |
| 11 | Afghanistan | 08.7 | 10.9 |
| 12 | Uganda | 09.4 | 11.1 |
| 13 | Togo | 09.4 | 12.7 |
| 14 | Kenya | 10.3 | 15.5 |
| 15 | Mozambique | 10.4 | 08.4 |
| 16 | Sierra Leone | 11.7 | 08.6 |
| 17 | Sri Lanka | 12.0 | 08.6 |
| 18 | Tanzania | 12.1 | 10.0 |
| 19 | Ivory Coast | 12.6 | 11.5 |
| 20 | Cambodia | 12.6 | 13.4 |
| q=185. | |||
| Meat Consumption Lower is better22 | |||
|---|---|---|---|
| Pos. | 2021 kg22 | 2010s Avg22 | |
| 185 | Hong Kong | 146.9 | 135.1 |
| 184 | USA | 126.8 | 118.5 |
| 183 | Nauru | 125.9 | |
| 182 | Mongolia | 115.6 | 84.3 |
| 181 | Argentina | 115.5 | 106.0 |
| 180 | Bahamas | 111.9 | 101.2 |
| 179 | Australia | 110.2 | 119.4 |
| 178 | St Vincent & Grenadines | 109.5 | 100.7 |
| 177 | Israel | 107.7 | 101.4 |
| 176 | Samoa | 106.2 | 103.9 |
| 175 | Spain | 100.3 | 98.4 |
| 174 | Brazil | 98.8 | 95.7 |
| 173 | Chile | 97.8 | 86.7 |
| 172 | St Kitts & Nevis | 96.6 | 91.2 |
| 171 | Portugal | 94.6 | 94.1 |
| 170 | French Polynesia | 92.5 | 96.1 |
| 169 | Croatia | 90.8 | 70.5 |
| 168 | Taiwan | 89.8 | 79.8 |
| 167 | St Lucia | 89.6 | 90.9 |
| 166 | Poland | 89.3 | 83.3 |
| q=185. | |||
There are six key arguments in favour of vegetarianism which accrue even from partial adoption: (1) Vegetarian diets have notable health advantages over carnivorous diets, especially for heart and cardiovascular issues23,24,25. (2) It is morally better to avoid killing or harming animals. (3) Plant-based diets use much less water than carnivorous ones, to the extent that agricultural and water management scientists urge governments to encourage people to switch26. (4) Vegetarian food production uses substantially less land23,27,28. (5) Growing vegetables for direct consumption is more efficient than using them to raise animals for meat in terms of resources, time and nutrition (including proteins). And, (6) vegetarianism is better for the environment than meat-production for emissions, sewerage, pollution and chemicals usage.23,27. A plant-based diet causes 75% less greenhouse gas emissions than a typical carnivorous diet28. The global food industry causes about 1/3 of all planet-heating emissions, and so "to slow the worst climate effects, the United Nations has called for a drastic reduction in meat consumption"28. Despite this, "reducing appetites for carbon-intensive meat and dairy is incredibly hard"29 and as countries get richer, they tend to eat more meat.
Meat Consumption By Global Region:
| Area | Meat Consumption (2021) Lower is better kg22 | 2010s Avg22 | |
|---|---|---|---|
| Africa... | 24.9 | 22.8 | |
| Asia... | 46.7 | 42.1 | |
| Australasia | 74.2 | 67.5 | |
| Europe... | 71.1 | 69.1 | |
| North America | 71.1 | 65.4 | |
| South America | 68.7 | 64.3 | |
| The Middle East... | 53.0 | 45.3 | |
| World | 52.5 | 49.0 | |
Note that these are values for the average country, not averages by total regional population.
1.7. Green Future Index
#climate_change #energy #sustainability #the_environment
| Green Future Index Higher is better30 | ||
|---|---|---|
| Pos. | 2023 Score30 | |
| 1 | Iceland | 6.7 |
| 2 | Finland | 6.7 |
| 3 | Norway | 6.4 |
| 4= | Sweden | 6.3 |
| 4= | Denmark | 6.3 |
| 6 | Netherlands | 6.2 |
| 7 | UK | 6.1 |
| 8 | S. Korea | 6.0 |
| 9 | France | 6.0 |
| 10= | Spain | 5.9 |
| 10= | Germany | 5.9 |
| 12 | Belgium | 5.8 |
| 13 | Italy | 5.7 |
| 14= | Ireland | 5.7 |
| 14= | Canada | 5.7 |
| 16 | Luxembourg | 5.6 |
| 17 | Greece | 5.6 |
| 18 | Portugal | 5.5 |
| 19 | USA | 5.4 |
| 20= | Switzerland | 5.4 |
| q=76. | ||
| Green Future Index Higher is better30 | ||
|---|---|---|
| Pos. | 2023 Score30 | |
| 76 | Iran | 2.6 |
| 75 | Algeria | 3.1 |
| 74 | Zambia | 3.3 |
| 73 | Qatar | 3.4 |
| 72 | Bangladesh | 3.5 |
| 71 | Paraguay | 3.6 |
| 70= | Guatemala | 3.6 |
| 68= | Russia | 3.6 |
| 68 | Malaysia | 3.7 |
| 67 | Pakistan | 3.7 |
| 66 | Uganda | 3.7 |
| 65 | Ghana | 3.8 |
| 64 | Cameroon | 3.8 |
| 63 | Turkey | 3.8 |
| 62 | Peru | 4.0 |
| 61 | Dominican Rep. | 4.0 |
| 60 | Egypt | 4.0 |
| 59 | Angola | 4.0 |
| 58 | Ethiopia | 4.0 |
| 57 | Kuwait | 4.1 |
| q=76. | ||
The Green Futures Index (GFI) has been running since 2021, and looks at 23 data sets for over 70 countries, with a focus on effectiveness, policy and planning 'for a low carbon future. It is complementary to existing goals and frameworks for sustainable development'. Datasets include qualitative appraisals and quantitative measurements on carbon emissions across multiple sectors, renewable and nuclear energy, recycling capabilities, green technologies used in building and construction, transport, scientific and industrial green innovations and patent quantities, climate action and climate policies. Each country is then ranked by their final score.31.
Green Future Index By Global Region:
| Green Future Index (2023)30 | ||
|---|---|---|
| Area | Higher is better Score30 | |
| Africa... | 4.0 | |
| Asia... | 4.3 | |
| Australasia | 4.6 | |
| Europe... | 5.6 | |
| North America | 4.7 | |
| South America | 4.5 | |
| The Middle East... | 3.9 | |
| World | 4.8 | |
Note that these are values for the average country, not averages by total regional population.
2. Overall Results by Country
#climate_change #human_development #the_environment
The overall scores are simply an average of each countries' position in all of the data sets that make up this category. Countries only receive a ranking if they have at least 7 different data points across the data sets. The overall results for each country are listed alongside their position in the Social and Moral Development Index.
| Pos. | Responsibility Towards The Environment (2025) Lower is better Avg Rank32 | Social & Moral Lower is better Avg Rank33 | |
|---|---|---|---|
| 1 | Sri Lanka | 34.9 | 76.9 |
| 2 | Uruguay | 43.2 | 54.5 |
| 3 | Switzerland | 45.0 | 32.7 |
| 4 | Morocco | 46.5 | 84.3 |
| 5 | Puerto Rico | 47.1 | |
| 6 | Burundi | 47.8 | 120.7 |
| 7 | Nepal | 47.9 | 100.1 |
| 8 | India | 49.5 | 94.2 |
| 9 | Philippines | 49.6 | 83.4 |
| 10 | Costa Rica | 49.7 | 56.8 |
| 11 | Denmark | 50.4 | 28.1 |
| 12 | Mali | 51.0 | 116.0 |
| 13 | Madagascar | 52.4 | 112.0 |
| 14 | Nigeria | 55.8 | 117.7 |
| 15 | Rwanda | 56.4 | 108.0 |
| 16 | Chile | 56.4 | 62.8 |
| 17 | Peru | 56.7 | 77.4 |
| 18 | Liechtenstein | 56.8 | 42.7 |
| 19 | Japan | 57.4 | 39.5 |
| 20 | Uganda | 57.8 | 112.3 |
| 21 | Kenya | 57.9 | 104.2 |
| 22 | Portugal | 58.0 | 46.7 |
| 23 | Mauritius | 58.1 | 67.2 |
| 24 | Germany | 58.2 | 39.9 |
| 25 | Ghana | 58.6 | 96.2 |
| 26 | Thailand | 59.5 | 70.8 |
| 27 | Spain | 59.5 | 44.0 |
| 28 | Austria | 59.6 | 40.5 |
| 29 | Tunisia | 60.1 | 78.1 |
| 30 | Vietnam | 60.6 | 81.9 |
| 31 | Niger | 61.3 | 121.1 |
| 32 | Greece | 61.4 | 56.3 |
| 33 | Tanzania | 61.6 | 110.9 |
| 34 | Ethiopia | 61.7 | 121.5 |
| 35 | Indonesia | 61.9 | 90.4 |
| 36 | Cameroon | 62.6 | 119.5 |
| 37 | Italy | 63.1 | 44.5 |
| 38 | Jordan | 63.1 | 91.9 |
| 39 | Ireland | 63.1 | 46.7 |
| 40 | Burkina Faso | 63.1 | 111.2 |
| 41 | Gambia | 63.3 | 112.6 |
| 42 | Senegal | 63.4 | 103.5 |
| 43 | Hong Kong | 64.6 | |
| 44 | Cyprus | 64.8 | 53.4 |
| 45 | Dominican Rep. | 65.0 | 85.4 |
| 46 | Ecuador | 65.6 | 81.6 |
| 47 | Hungary | 65.8 | 54.2 |
| 48 | Guatemala | 66.1 | 90.1 |
| 49 | Lesotho | 66.1 | 108.5 |
| 50 | Mexico | 66.3 | 77.1 |
| q=199. | |||
| Pos. | Responsibility Towards The Environment (2025) Lower is better Avg Rank32 | Social & Moral Lower is better Avg Rank33 | |
|---|---|---|---|
| 51 | Norway | 66.9 | 29.9 |
| 52 | Guinea | 67.1 | 123.7 |
| 53 | El Salvador | 67.4 | 83.3 |
| 54 | Bangladesh | 69.7 | 107.1 |
| 55 | Brazil | 70.2 | 70.1 |
| 56 | Maldives | 70.5 | 92.6 |
| 57 | Ivory Coast | 70.8 | 116.4 |
| 58 | Colombia | 70.9 | 80.9 |
| 59 | Togo | 71.1 | 114.2 |
| 60 | Netherlands | 71.1 | 31.8 |
| 61 | Luxembourg | 71.4 | 37.6 |
| 62 | Sweden | 71.8 | 31.0 |
| 63 | Finland | 71.9 | 33.7 |
| 64 | Yemen | 71.9 | 130.8 |
| 65 | Pakistan | 72.0 | 118.6 |
| 66 | France | 72.8 | 40.0 |
| 67 | Congo, DR | 73.0 | 131.9 |
| 68 | Romania | 73.8 | 70.1 |
| 69 | Swaziland | 74.2 | 115.8 |
| 70 | Chad | 74.4 | 130.6 |
| 71 | UK | 74.4 | 49.9 |
| 72 | Turkey | 75.0 | 81.7 |
| 73 | China | 75.2 | 81.1 |
| 74 | Belgium | 75.3 | 38.4 |
| 75 | Cape Verde | 75.6 | 86.6 |
| 76 | Afghanistan | 75.7 | 141.4 |
| 77 | New Zealand | 75.8 | 42.9 |
| 78 | Bulgaria | 75.8 | 68.5 |
| 79 | Malawi | 76.0 | 118.1 |
| 80 | Benin | 76.5 | 115.3 |
| 81 | Australia | 76.6 | 44.0 |
| 82 | Botswana | 76.8 | 96.5 |
| 83 | Syria | 77.4 | 118.4 |
| 84 | Congo, (Brazzaville) | 77.6 | 117.4 |
| 85 | Latvia | 77.7 | 62.4 |
| 86 | Egypt | 78.0 | 99.9 |
| 87 | Argentina | 78.5 | 68.6 |
| 88 | Dominica | 78.5 | 84.1 |
| 89 | Iran | 79.0 | 101.4 |
| 90 | Cuba | 79.4 | 79.2 |
| 91 | Algeria | 79.7 | 97.7 |
| 92 | Nicaragua | 80.5 | 95.0 |
| 93 | Slovakia | 80.8 | 55.9 |
| 94 | Poland | 81.0 | 54.3 |
| 95 | UAE | 81.8 | 83.4 |
| 96 | Bolivia | 81.8 | 89.7 |
| 97 | Slovenia | 82.1 | 45.7 |
| 98 | Panama | 82.5 | 79.8 |
| 99 | Singapore | 83.3 | 56.4 |
| 100 | Georgia | 83.6 | 82.9 |
| q=199. | |||
| Pos. | Responsibility Towards The Environment (2025) Lower is better Avg Rank32 | Social & Moral Lower is better Avg Rank33 | |
|---|---|---|---|
| 101 | Sierra Leone | 83.6 | 121.0 |
| 102 | Guinea-Bissau | 83.7 | 122.0 |
| 103 | Namibia | 83.9 | 106.4 |
| 104 | S. Korea | 84.0 | 49.6 |
| 105 | Cambodia | 84.0 | 112.4 |
| 106 | Central African Rep. | 84.2 | 128.3 |
| 107 | Djibouti | 84.5 | 116.1 |
| 108 | Honduras | 84.6 | 93.8 |
| 109 | Zambia | 85.4 | 116.1 |
| 110 | Venezuela | 86.1 | 95.6 |
| 111 | Taiwan | 86.1 | 50.0 |
| 112 | Macedonia | 86.9 | 76.4 |
| 113 | Canada | 87.2 | 44.1 |
| 114 | Guyana | 87.4 | 98.6 |
| 115 | Gabon | 87.9 | 109.2 |
| 116 | Croatia | 88.5 | 63.4 |
| 117 | Jamaica | 88.6 | 82.4 |
| 118 | Fiji | 89.1 | 89.8 |
| 119 | Czechia | 89.3 | 50.1 |
| 120 | Malaysia | 89.5 | 72.5 |
| 121 | Lithuania | 89.5 | 64.3 |
| 122 | Paraguay | 91.0 | 92.0 |
| 123 | Equatorial Guinea | 91.2 | 136.0 |
| 124 | Belize | 91.3 | 98.3 |
| 125 | Albania | 91.5 | 76.1 |
| 126 | St Vincent & Grenadines | 92.0 | 87.4 |
| 127= | Monaco | 92.1 | 41.2 |
| 127= | Moldova | 92.1 | 80.4 |
| 129 | S. Africa | 92.2 | 91.1 |
| 130 | Malta | 92.2 | 56.0 |
| 131 | Sao Tome & Principe | 92.7 | 107.5 |
| 132 | Palestine | 92.7 | 106.8 |
| 133 | Vanuatu | 93.0 | 106.7 |
| 134 | Mozambique | 93.9 | 125.4 |
| 135 | Qatar | 94.1 | 90.7 |
| 136 | Liberia | 94.2 | 127.4 |
| 137 | Trinidad & Tobago | 94.5 | 81.5 |
| 138 | Ukraine | 94.8 | 80.6 |
| 139 | Saudi Arabia | 94.9 | 105.1 |
| 140 | Israel | 95.8 | 62.3 |
| 141 | Tonga | 96.1 | 96.0 |
| 142= | St Kitts & Nevis | 96.9 | 89.4 |
| 142= | Iceland | 96.9 | 38.4 |
| 144= | Laos | 97.0 | 120.3 |
| 144= | Estonia | 97.0 | 57.1 |
| 146 | Montenegro | 97.3 | 70.1 |
| 147 | Sudan | 97.8 | 134.5 |
| 148 | Comoros | 99.1 | 124.4 |
| 149 | Russia | 99.2 | 85.6 |
| 150 | Myanmar | 99.9 | 126.1 |
| q=199. | |||
| Pos. | Responsibility Towards The Environment (2025) Lower is better Avg Rank32 | Social & Moral Lower is better Avg Rank33 | |
|---|---|---|---|
| 151 | Kuwait | 100.5 | 84.8 |
| 152 | Bahamas | 100.9 | 86.2 |
| 153 | Azerbaijan | 101.2 | 98.5 |
| 154 | Mauritania | 101.2 | 124.8 |
| 155 | Oman | 101.8 | 94.6 |
| 156 | Iraq | 102.8 | 123.1 |
| 157 | Antigua & Barbuda | 103.2 | 84.4 |
| 158 | Seychelles | 103.4 | 78.6 |
| 159 | Bosnia & Herzegovina | 103.5 | 82.4 |
| 160 | St Lucia | 103.6 | 92.6 |
| 161 | USA | 103.8 | 66.1 |
| 162 | Lebanon | 103.9 | 95.9 |
| 163 | Papua New Guinea | 104.5 | 123.0 |
| 164 | Serbia | 104.8 | 74.0 |
| 165 | Haiti | 105.8 | 118.6 |
| 166 | Samoa | 107.0 | 108.9 |
| 167 | Bahrain | 107.9 | 90.7 |
| 168 | Mongolia | 108.1 | 92.5 |
| 169 | Armenia | 108.2 | 87.0 |
| 170 | Suriname | 108.5 | 95.6 |
| 171 | Kyrgyzstan | 108.7 | 94.1 |
| 172 | Angola | 109.5 | 141.1 |
| 173 | Kazakhstan | 109.8 | 87.4 |
| 174 | Barbados | 110.1 | 77.8 |
| 175 | Kiribati | 111.4 | 115.1 |
| 176 | Micronesia | 114.6 | 111.1 |
| 177 | Bhutan | 115.3 | 101.9 |
| 178 | Belarus | 116.0 | 87.2 |
| 179 | Uzbekistan | 116.1 | 98.5 |
| 180 | Cook Islands | 119.6 | |
| 181 | Libya | 121.4 | 113.5 |
| 182 | Zimbabwe | 121.5 | 123.3 |
| 183 | Solomon Islands | 121.6 | 122.4 |
| 184 | Marshall Islands | 123.1 | 123.4 |
| 185 | Palau | 124.5 | 96.5 |
| 186 | Grenada | 125.0 | 90.0 |
| 187 | Tuvalu | 127.4 | 112.5 |
| 188 | Tajikistan | 128.6 | 104.8 |
| 189 | Niue | 129.5 | |
| 190 | Brunei | 130.2 | 89.4 |
| 191 | Somalia | 131.0 | 160.0 |
| 192 | N. Korea | 132.3 | 109.9 |
| 193 | Turkmenistan | 134.1 | 108.2 |
| 194 | Nauru | 134.4 | 120.8 |
| 195 | San Marino | 134.9 | 56.8 |
| 196 | Andorra | 136.3 | 64.8 |
| 197 | Timor-Leste (E. Timor) | 137.5 | 110.3 |
| 198 | Vatican City | 138.3 | 86.3 |
| 199 | Eritrea | 146.2 | 146.1 |
| q=199. | |||
3. Overall Results by Region
#biodiversity #climate_change #deforestation #energy #environmentalism #food #human_development #internationalism #meat #over-exploitation #sustainability #the_environment #veganism #vegetarianism
| Area | Responsibility Towards The Environment (2025) Lower is better Avg Rank32 | Social & Moral Lower is better Avg Rank33 | |
|---|---|---|---|
| Africa... | 78.58 | 115.3 | |
| Asia... | 88.09 | 92.4 | |
| Australasia | 109.27 | 100.9 | |
| Baltic States | 88.07 | 61.3 | |
| Central America | 74.57 | 85.3 | |
| Europe... | 82.54 | 57.5 | |
| Melanesia | 102.07 | 110.5 | |
| Micronesia | 121.61 | 113.4 | |
| North America | 86.24 | 83.6 | |
| Polynesia | 109.23 | 90.1 | |
| Scandinavia... | 75.81 | 36.4 | |
| Small Islands... | 100.10 | 92.4 | |
| South America | 74.69 | 80.6 | |
| The Americas... | 82.39 | 82.6 | |
| The Balkans | 88.73 | 73.2 | |
| The Caribbean... | 92.19 | 87.6 | |
| The Mediterranean | 81.77 | 73.3 | |
| The Middle East... | 87.36 | 95.0 | |
| World | 84.93 | 89.4 | |
The table here shows overall results for this category, compared with each region's average score on the Social and Moral Development Index. Regional values are calculated as an average of national results, not by total regional population. The tables below show results for each data set for each region.
The Environment Data Sets by Region:
| Area | Forest Area Change 2000-2020 Higher is better2 | Environmental Performance (2018) Higher is better13 | Energy to GDP Efficiency (2022) Lower is better Avg15 | International Accords on the Environment Higher is better Avg Rate | Rational Beliefs on the Environment (2011) Higher is better %21 | Meat Consumption (2021) Lower is better kg22 | Green Future Index (2023) Higher is better Score30 | |
|---|---|---|---|---|---|---|---|---|
| Africa... | -8.7% | 46.4 | 0.83 | 56.4% | 38.3% | 24.9 | 4.0 | |
| Asia... | 3.2% | 54.5 | 1.50 | 55.4% | 37.9% | 46.7 | 4.3 | |
| Australasia | 0.1% | 55.2 | 1.23 | 48.2% | 28.0% | 74.2 | 4.6 | |
| Baltic States | 7.6% | 66.6 | 1.07 | 79.0% | 20.3% | 76.5 | ||
| Central America | -12.8% | 57.3 | 0.99 | 64.2% | 63.2% | 51.4 | 4.4 | |
| Europe... | 8.2% | 69.6 | 1.25 | 62.7% | 33.6% | 71.1 | 5.6 | |
| Melanesia | 1.9% | 45.1 | 52.2% | 50.3 | ||||
| Micronesia | -0.4% | 52.5 | 40.6% | 82.9 | ||||
| North America | -2.0% | 58.9 | 1.40 | 57.7% | 54.2% | 71.1 | 4.7 | |
| Polynesia | -0.6% | 64.3 | 1.22 | 47.7% | 24.2% | 93.3 | 4.6 | |
| Scandinavia... | 10.4% | 76.9 | 1.69 | 74.9% | 18.6% | 73.6 | 6.5 | |
| Small Islands... | 1.8% | 57.4 | 1.64 | 49.5% | 44.9% | 67.7 | 4.5 | |
| South America | -2.5% | 58.6 | 1.45 | 66.5% | 63.8% | 68.7 | 4.5 | |
| The Americas... | -2.1% | 58.8 | 1.42 | 60.7% | 58.6% | 70.3 | 4.6 | |
| The Balkans | 11.0% | 61.2 | 1.34 | 56.9% | 38.7% | 63.5 | 5.4 | |
| The Caribbean... | 1.6% | 57.6 | 1.62 | 52.3% | 44.9% | 75.9 | 4.0 | |
| The Mediterranean | 7.5% | 65.8 | 1.23 | 56.4% | 40.1% | 59.1 | 4.8 | |
| The Middle East... | 7.2% | 60.0 | 1.60 | 51.5% | 35.1% | 53.0 | 3.9 | |
| World | -0.1% | 56.4 | 1.23 | 57.5% | 39.9% | 52.5 | 4.8 | |
4. The Social and Moral Development Index
The data sets form part of the calculations for the Human Truth Foundation's Social and Moral Development Index.
The Social and Moral Development Index concentrates on moral issues and human rights, violence, public health, equality, tolerance, freedom and effectiveness in climate change mitigation and environmentalism, and on some technological issues. A country scores higher for achieving well in those areas, and for sustaining that achievement in the long term. Those countries towards the top of this index can truly said to be setting good examples and leading humankind onwards into a bright, humane, and free future. See: Which are the Best Countries in the World? The Social and Moral Development Index.
GDP per unit of energy consumption is often called 'Energy Intensity'. It's how efficient countries are at producing GDP in terms of primary energy use. It represents primary energy consumption using the substitution method, per unit of gross domestic product (GDP). A lower value means that less energy was used to maintain the country's GDP.
The Environmental Performance Index 2018 data includes 24 indicators including air pollution, water and sanitation, biodiversity, ecosystems and environmental health, combined into a single score by country, by the Yale University Center for Environmental Law & Policy.