USA's Health Versus Obesity, Commercialism and Conspiracy Theories
https://www.humantruth.info/usa_health.html
By Vexen Crabtree 2025
| USA United States of America [Country Profile Page] |  |
|---|---|
| Status | Independent State |
| Social and Moral Index | 46th best |
| Capital | Washington |
| Land Area | 9 147 420km21 |
| Location | North America, The Americas |
| Population | 327.1m2 |
| Life Expectancy | 77.20yrs (2017)3 |
| GNI | $64 765 (2017)4 |
| ISO3166-1 Codes | US, USA, 8405 |
| Internet Domain | .us6 |
| Currency | Dollar (USD)7 |
| Telephone | +18 |
The USA does relatively well in encouraging good health, compared to many other countries. The USA comes in the best 20 in its food aid and health contributions and WHO compliance9 (amongst the lowest in The Americas). It does better than average in terms of childhood mortality in the 2020s10, its average life expectancy11 (although the USA is unique for a modern country, in that this is now declining12), its fertility rate13, its adolescent birth rate14 (amongst the best in The Americas) and in delivery rate of infant DTP immunizations in the 2020s15. But, things could still be better. The US healthcare system is the most costly, least accessible and least cost efficient amongst democracies. The USA does worse than average when it comes to its suicide rate16, delivery rate of 7x Infant Immunizations 2011-201517, its smoking rate18, its alcohol consumption rate19 (one of the highest in The Americas) and in the prevalence of overweight adults20 (one of the worst in The Americas). The prevalence of overweight adults has increased by 14% during the past 40 years.
Many US chronic diseases are preventable through lifestyle choices21 but the health sector is distorted by commercialist pressures and symptoms of long-term mismanagement; poor messaging and education feeds a widespread public reliance on pseudoscience, wellness fads, and unproven quack remedies. Annual spending on alternative remedies rose 50% in the 1990s, to $27 billion22. The food industry that has little incentive to make healthy food cheaper by default; its powerful lobby produces swathes of misinformation and misleading advertising that obscures any evidence-based guidance on nutrition and lifestyle.
In 2025, the Trump administration has been making things substantially worse. Key health and science positions have been filled by vocal anti-science figures who have dismissed experts, dismantled research, suppressed studies, and erased data that contradicts their personal beliefs (which are often based in conspiracy theories). Science and health research has been decimated. 2025 stands as one of the most perilous and regressive years for health in the USA, causing added dysfunction that will take a decade to fix.
1. USA's Health
| Health (2025)23 | ||
|---|---|---|
| Pos. | Lower is better Avg Rank23 | |
| 1 | Monaco | 10.3 |
| 2 | Liechtenstein | 30.1 |
| 3 | Japan | 37.3 |
| ... | ||
| 35 | Austria | 65.8 |
| 36 | Cyprus | 65.8 |
| 37 | Germany | 66.6 |
| 38 | USA | 66.8 |
| 39 | Ireland | 67.2 |
| 40 | New Caledonia | 68.1 |
| 41 | Greece | 68.3 |
| 42 | N. Korea | 68.8 |
| World Avg | 97.57 | |
| q=207. | ||
The countries with the best overall approach to public health, in terms of both public policy and individual lifestyle choices, are Monaco, Liechtenstein and Japan24. These countries are worth emulating. And, although often through no fault of the average citizen, the worst countries are Angola, Somalia and S. Sudan24.
42 datasets are used to calculate points for each country, including multiple decades of data on its average life expectancy, its alcohol consumption rate, its fertility rate, its smoking rate, its suicide rate, its food aid and health contributions and WHO compliance, the prevalence of overweight adults, obesity rate, its adolescent birth rate, delivery rate of infant DTP immunizations, delivery rate of 7x Infant Immunizations 2011-2015 and childhood mortality. The regions with the best average results per country are Scandinavia, Europe and The Mediterranean24, whereas the worst are Africa, Micronesia and Melanesia24.
For more, see:
Cultural Health Sector Problems
The core problem with US health, is US culture. Many US chronic diseases are preventable through lifestyle choices21. The Centers for Disease Control and Prevention estimates that eliminating poor diet, inactivity and smoking would prevent 80% of heart disease and stroke cases, 80% of type 2 diabetes developments and 40% of all cancer21.
US health services are provided at cost according to a commercialist regime, but almost nothing - just 4% of health spending - is on preventative education and programmes on healthy behaviour. This is because the health system is designed to provide chargeable services, with no particular pressure to lookout for holistic health, and very few bodies responsible for managing the combination of lifestyle, environment and long-term causes of ill-health. Social care spending is simply worth it, not least for the humanitarian factor, but economically: "A review of eight health promotion programs found a savings in health care costs of $3.35 for every dollar invested"21.
In fighting bad diets and obesity, other countries take measures such as banning the advertising of junk food to children, not allowing fast-food outlets within a certain distance of schools, and, the best examples of all are set by the public health systems of Europe, where, compared to commercial and insurance-led health systems, the state pays for a much greater portion of health care, and therefore, there are public bodies that absolutely have in their interests preventative care, preventative education, and closer regulation of the food sector; because each step in those directions saves the state money later. Regardless of higher taxes, the result is a happier and healthier population, and much less spent on health care overall, than in the USA.
Pseudoscience, Misinformation and Alternative Therapies
#alternative_therapies #health #pseudoscience #USA
The health sector is distorted by commercialist pressures and symptoms of long-term mismanagement; poor messaging and education feeds a widespread public reliance on pseudoscience, wellness fads, and unproven quack remedies. A powerful food-industry lobby produces swathes of misinformation and misleading advertising that obscures any evidence-based guidance on nutrition and lifestyle.
The result is a population that is lost, and medical system that panders to those who are lost. One in four US adults use some form of alternative therapy25.
“Alternative medicine's popularity appears to be increasing. [...] Americans spent $27 billion on alternative medicine, a 50 percent increase from 1990. [...] Responding to consumer demand, health care companies have extended coverage to a number of alternative practices including chiropractic and acupuncture.
[But medical education is not addressing it well enough. Dr Wallace Sampson notes] not only a "science gap" but a "knowledge of science gap." He said that there has been enough study of some therapies like homeopathy that have been proven to be "physically impossible and worthless," but both consumers and physicians seldom are made aware.”
Skeptical Inquirer (1999)22
Mainstream medical professionals are having to spend an increasing amount of time dealing with the damage done by alternative medicine; the disinformation and confusion it causes, the delays in seeking real medical help causes problems to become more complicated and more expensive to treat, and in the USA where political interference means that alternative products are being pushed top-down, the very case for science-based, carefully-checked medicine is having to be made. Doctors are having to become teachers, and medical bodies are having to justify their own existence. All of this is a worrying distraction from spending time on actually implementing treatments that are already proven, on a populace (and political cadre) that is misinformed and reluctant to listen.
2. Health Datasets
2.1. Life Expectancy
#demographics #health #hong_kong #immigration #japan #life_expectancy #longevity #population
| Life Expectancy Higher is better11 | ||
|---|---|---|
| Pos. | 2021 Years11 | |
| 1 | Monaco | 85.9 |
| 2 | Hong Kong | 85.5 |
| 3 | Japan | 84.8 |
| ... | ||
| 43 | Czechia | 77.7 |
| 44 | Croatia | 77.6 |
| 45 | Barbados | 77.6 |
| 46 | USA | 77.2 |
| 47 | Estonia | 77.1 |
| 48 | Costa Rica | 77.0 |
| 49 | Saudi Arabia | 76.9 |
| 50 | Albania | 76.5 |
| World Avg | 71.28 | |
| q=195. Also scored for 1990s-2010s. | ||
Increasing longevity, and subsequent aging, is a long-term trend around the world26. Global life expectancy is now over 70; since 2000 it has risen by 6.3 and in 2019 achieved 73.1 years27, as part of a global trend towards better health28,29, and due to huge portions of the world being gradually lifted out of poverty. It also reflects overall improvements to cultural health, including diet, health services systems, attitudes to exercise and well-being, and also family structure and caring. For decades, Japan was well-known for having the highest average life expectancy30, until the top spot was taken by Hong Kong. The regions with the best life expectancy are Europe (78.4), The Middle East (75.2) and Asia (73.2)11 and the worst, by some way, is Africa (62.8)11.
One effect of rising longevity is the 'demographics crisis'; where an increasing portion of the population is old and retired, putting pressure on services and taxes31. The solution is for aging countries to import younger workers from elsewhere; over time, as birth rates stabilize, geriatric care improves the length of the working life, and population growth calms, this situation will stabilize.
For more, see:
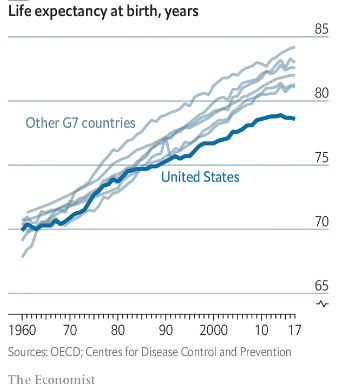
Source:12
By 2008 parts of the USA's population's life expectancy was decreasing due to smoking, obesity and high blood pressure32 and by 2011 the USA was lagging behind other developed countries in terms of improvements in life expectancy. "Researchers at the National Research Council estimated that America's high rates of obesity accounted for between one-fifth and one-third of its lagging life expectancy relative to other rich countries" and there are concerns that obesity alone could rise to such prominence that the USA's average life expectancy become the first in the modern world to begin to drop - although others such as James Vaupel, director of Duke University's Population Research Institute, thinks that rising rates of disability is going to the more worrying result of obesity33.
Averages by decade for the USA (for the ranks, lower is better):
| Life Expectancy | 1990s Average | 2000s Average | 2010s Average |
|---|---|---|---|
| the USA: | 76.0 | 77.6 | 78.9 |
| World Rank: | 29th | ⇣ 36th | ⇣ 42nd |
| World Avg: | 65.3 | 68.2 | 71.4 |
2.2. Alcohol Consumption
| Alcohol Consumption Lower is better19 | ||
|---|---|---|
| Pos. | 2016 Per Capita19 | |
| 1 | Bangladesh | 0.0 |
| 2 | Kuwait | 0.0 |
| 3 | Libya | 0.0 |
| ... | ||
| 145= | Argentina | 9.8 |
| 145= | Georgia | 9.8 |
| 145= | Namibia | 9.8 |
| 145= | USA | 9.8 |
| 149= | St Lucia | 9.9 |
| 149= | Swaziland | 9.9 |
| 151 | Spain | 10.0 |
| 152 | S. Korea | 10.2 |
| World Avg | 6.2 | |
| q=189. | ||
There is nothing wrong with drinking modest and sensible amounts of alcohol but fitness, physical health, mental health and long-term health all suffer as a result of medium- or heavy- drinking34 and the health risks to the baby when pregnant mothers drink35 are well-known. Aside from the effects on the individual, alcohol misuse impacts on entire economies36 via increased health service costs, policing costs and lost days' work. Worldwide, alcohol misuse is "among the top five risk factors for disease, disability and death" and is a "cause of more than 200 disease and injury conditions in individuals, most notably alcohol dependence, liver cirrhosis, cancers and injuries"37. "In 2012... 5.9% of all global deaths, were attributable to alcohol consumption"38. Deaths from chronic alcohol misuse have been rising for decades, and so has violence, abuse, vandalism and crime all associated with alcohol over-use. The aggression and crime associated with alcohol in some Western countries infringes on the human rights of those who want nothing to do with such behaviour. Many of the social effects of alcohol are psychological and cultural; i.e., people don't have to behave criminally or destructively whilst drunk - it is a culturally learned behaviour. Experiments have shown that behaviour can be controlled: Those who do not wish to behave badly whilst drunk, will not do so.
For more, see:
2.3. Fertility Rate
#birth_control #demographics #fertility #health #overpopulation #population #yemen
| Fertility Rate 2.0 is best13 | ||
|---|---|---|
| Pos. | 202213 | |
| 1 | US Virgin Islands | 2.00 |
| 2 | Ecuador | 2.00 |
| 3 | Nepal | 2.01 |
| ... | ||
| 48= | Suriname | 2.32 |
| 48= | Cambodia | 2.32 |
| 50 | Azerbaijan | 1.67 |
| 51 | USA | 1.67 |
| 52 | Honduras | 2.34 |
| 53 | New Zealand | 1.66 |
| 54 | S. Africa | 2.34 |
| 55 | Turks & Caicos Islands | 1.66 |
| World Avg | 2.47 | |
| q=208. Also scored for 1960s-2010s. | ||
The fertility rate is, in simple terms, the average amount of children that each woman has. The higher the figure, the quicker the population will grow, although, to calculate the rate you also need to take into account morbidity - the rate at which people die. If people live healthy and long lives and morbidity is low, then, 2.0 approximates to the replacement rate (two new children for each set of parents who die), which would keep the population stable. If all countries had such a fertility rate, population growth would end. The actual replacement rate in most developed countries is around 2.1, once you take mortality into account39. The highest fertility rate ever detected in a single year was in Yemen in 1985, at 8.86.40
For more, see:
Averages by decade for the USA (for the ranks, lower is better):
| Fertility Rate | 1960s Average | 1970s Average | 1980s Average | 1990s Average | 2000s Average | 2010s Average |
|---|---|---|---|---|---|---|
| the USA: | 3.04 | 1.93 | 1.86 | 2.01 | 2.06 | 1.83 |
| World Rank: | 38th | ⇡ 9th | ⇣ 17th | ⇡ 2nd | ⇣ 10th | ⇣ 35th |
| World Avg: | 5.35 | 4.78 | 4.22 | 3.57 | 3.03 | 2.73 |
2.4. Smoking in the 2020s
#cancer #democracy #health #smoking
| Smoking in the 2020s Lower is better18 | ||
|---|---|---|
| Pos. | Total %18 | |
| 1 | Nigeria | 3.3% |
| 2 | Ghana | 3.4% |
| 3 | Panama | 5.2% |
| ... | ||
| 109 | Poland | 23.6% |
| 110 | Argentina | 23.8% |
| 111 | India | 24.4% |
| 112 | USA | 24.4% |
| 113 | Lesotho | 24.5% |
| 114 | Malta | 24.8% |
| 115 | Egypt | 24.8% |
| 116 | Austria | 24.9% |
| World Avg | 20.0% | |
| q=165. Also scored for 2000s-2020s. | ||
Cigarettes are the most lethal consumer product on the planet, responsible for over 7 million deaths annually41 and therefore the biggest preventable cause of disease in the world42. A billion people smoke43. The tobacco industry has resisted with misinformation and well-funded public-relations campaigns, opposing and undermining health measures wherever it can; if defeated, firms continue the same abuses in other countries44. The industry has such rich and influential lobbies that most governments find it difficult to make progress in curbing smoking rates.
If you smoke, you are more likely to drink. If you smoke or drink, you are also more likely to do drugs. Only 15% of men in the highest professional classes smoke, but 42% of unskilled workers do45. Smoking is higher amongst those who are already in trouble: single mothers smoke at 55%, most homeless do and practically all drug addicts do45. Smoking during late pregnancy reduces the IQ of babies by an average of 6.2 points46 and causes increased antisocial behaviour. Aside from the financial cost to taxpayers and the health costs to individuals, indirect negative economic effects result from increased rates of disease and sick days lost from work41.
For more, see:
Averages by decade for the USA (for the ranks, lower is better):
| Smoking | 2000s Average | 2010s Average | 2020s Average |
|---|---|---|---|
| the USA: | 30.0% | 27.1% | 24.4% |
| World Rank: | 94th | ⇣ 109th | ⇣ 112th |
| World Avg: | 27.9% | 23.5% | 20.0% |
2.5. Suicide Rate
#belgium #finland #health #japan #mental_health #suicide #switzerland
| Suicide Rate16 | ||
|---|---|---|
| Pos. | 2013 Per 100k16 | |
| 1 | Haiti | 0 |
| 2 | Grenada | 0 |
| 3 | Egypt | 0.1 |
| ... | ||
| 50 | Singapore | 20.6 |
| 51 | India | 20.8 |
| 52 | Trinidad & Tobago | 21.7 |
| 53 | USA | 22.2 |
| 54 | Chile | 22.4 |
| 55 | Canada | 22.7 |
| 56 | Iceland | 23.5 |
| 57 | New Zealand | 23.6 |
| World Avg | 20.93 | |
| q=91. | ||
Suicide as a human behaviour is recorded in the texts of the most ancient civilisations. But reliable statistics on it are hard to collect. The World Health Organisation publishes the statistics used by the United Nations, which is duplicated in the long table on the right.
Almost universally, successful male suicide rates are much higher than female rates. However, female suicide attempts are more frequent than male attempts.
Countries with high suicide rates are a mixture between those riddled with organized criminal gangs, under-developed countries, and, highly developed countries. There are cultural and situational effects at work that persist in the long-term: nothing seems to lower the high suicide rates in Japan, Belgium and Finland. And some of the countries with the lowest rates are not particularly well developed socially. It seems there is no correlation between suicide rates and things like development, prosperity and national engagement in human rights.
Switzerland comes in as the country with the 17th highest suicide rate despite its liberal stance, with 36.2 suicides per 100,000 people.
For more, see:
2.6. Food Aid, Health Contributions & WHO Compliance
| Food Aid, Health Contributions & WHO Compliance Lower is better9 | ||
|---|---|---|
| Pos. | 2017 Rank9 | |
| 1 | Sweden | 1 |
| 2 | Ireland | 2 |
| 3 | Denmark | 3 |
| ... | ||
| 7 | Germany | 7 |
| 8 | Canada | 8 |
| 9 | Netherlands | 9 |
| 10 | USA | 10 |
| 11 | Luxembourg | 11 |
| 12 | Finland | 12 |
| 13 | Australia | 13 |
| 14 | UAE | 14 |
| World Avg | 82.0 | |
| q=163. | ||
2.7. Overweight Adults
| Overweight Adults Lower is better20 | ||
|---|---|---|
| Pos. | 1976 %20 | |
| 1 | Bangladesh | 4.7 |
| 2 | Vietnam | 5.1 |
| 3 | Nepal | 5.4 |
| ... | ||
| 160= | Lebanon | 41.2 |
| 160= | Greece | 41.2 |
| 162 | Bulgaria | 41.4 |
| 163= | USA | 41.6 |
| 163= | Spain | 41.6 |
| 165 | Ukraine | 42.2 |
| 166 | Australia | 42.4 |
| 167 | Lithuania | 42.6 |
| World Avg | 27.1 | |
| q=191. | ||
2.8. Adult Obesity
#genetics #health #obesity #physical_fitness #public_health
| Adult Obesity Lower is better47 | ||
|---|---|---|
| Pos. | 2022 %47 | |
| 1 | Vietnam | 2.1% |
| 2 | Timor-Leste (E. Timor) | 2.2% |
| 3 | Ethiopia | 2.4% |
| ... | ||
| 179 | Saudi Arabia | 41.1% |
| 180 | Belize | 41.9% |
| 181 | Palau | 42.2% |
| 182 | USA | 42.9% |
| 183 | Egypt | 43.0% |
| 184 | Qatar | 43.8% |
| 185 | Kuwait | 45.4% |
| 186 | Micronesia | 45.6% |
| World Avg | 24.7% | |
| q=199. Also scored for 1990s-2010s. | ||
About one third of the global population is overweight or obese48. It's more serious than simply being overweight and causes a range of systemic health conditions including the development of Type 2 diabetes49,50, muscle and bone degradation including osteoarthritis49, cardiovascular disease (i.e. heart disease, which causes 40% of all US deaths21)49, substantial disability49, cancers (endometrial, breast and colon)49, the acceleration of the ageing process51 and decreased life expectancy49,51. Health systems have to routinely cope with resultant complications, and cultural changes are having to be made52, impacting on transport, resources and workplaces, with measurable effects on national economies, diverting time and resources away from other issues. In 2000, it was the world's most costly epidemic52, and has continued to get worse across all regions of the world every decade since53; from 2000 to 2019 diabetes has caused a 0.14-year slowdown in the increase in healthy life expectancy54.
The causes are lifestyle and culture55,49, not genetics56,57. Causes are processed foods, low levels of physical exercise, over-indulgence, poor choices in food products and poor knowledge of nutrition. Health experts have warned that there is no medical solution: prevention is the only possible route to reduce the cost of obesity58 but the situation is made much worse by well-funded advertising campaigns by food manufacturers selling cheap mass-produced food. Even many so-called "health foods" contain well over recommended limits of fat, salt and sugar59 and a range of popular fad diets capitalize on miseducated consumers to buy into costly and nonsensical schemes that falsely promise quick results60.
For more, see:
The USA's obesity pandemic has spanned a few generations.
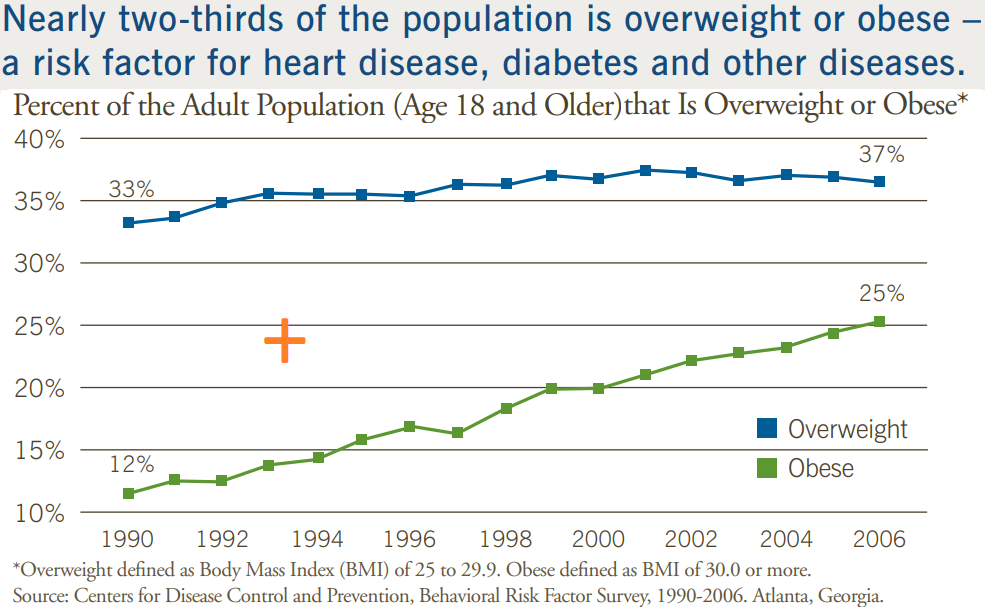
Source: Health for Life (2007)21
It causes layers of complications and personal difficulties. "Annual health care costs are 35 percent higher for obese individuals relative to normal weight individuals. Each year, approximately 300,000 deaths are attributed to obesity" (from 2007)21 and "if population-wide cholesterol levels could be reduced by 10 percent, the incidence of coronary artery disease could drop by an estimated 30 percent"21.
Averages by decade for the USA (for the ranks, lower is better):
| Adult Obesity | 1990s Average | 2000s Average | 2010s Average |
|---|---|---|---|
| the USA: | 22.6% | 32.1% | 38.9% |
| World Rank: | 184th | ⇡ 183rd | 183rd |
| World Avg: | 12.5% | 16.7% | 21.0% |
3. Children's Health Datasets
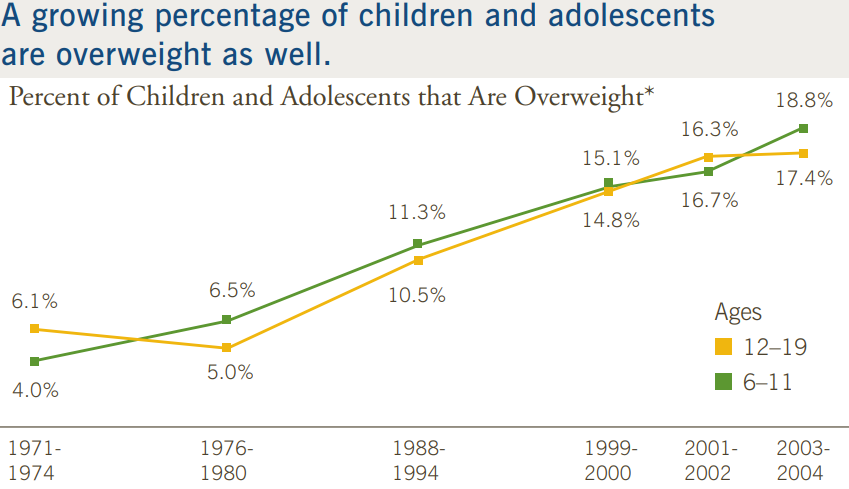
Source: Health for Life (2007)21
3.1. Adolescent Birth Rate
#health #parenting #population
| Adolescent Birth Rate Lower is better14 | ||
|---|---|---|
| Pos. | 2022 Per 100014 | |
| 1 | Hong Kong | 1.6 |
| 2 | Denmark | 1.8 |
| 3 | S. Korea | 2.1 |
| ... | ||
| 57 | Serbia | 14.4 |
| 58 | Albania | 14.5 |
| 59 | Russia | 14.5 |
| 60 | USA | 15.1 |
| 61 | Ukraine | 15.2 |
| 62 | Sri Lanka | 15.4 |
| 63 | Turkey | 15.7 |
| 64 | Uzbekistan | 15.7 |
| World Avg | 43.8 | |
| q=195. Also scored for 1990s-2010s. | ||
Averages by decade for the USA (for the ranks, lower is better):
| Adolescent Birth Rate | 1990s Average | 2000s Average | 2010s Average |
|---|---|---|---|
| the USA: | 54.9 | 40.9 | 23.9 |
| World Rank: | 87th | 87th | ⇡ 66th |
| World Avg: | 71.0 | 59.4 | 51.4 |
3.2. Infant DTP Immunizations (2020s)
#children's_health #health #vaccines
| Infant DTP Immunizations (2020s) Higher is better15 | ||
|---|---|---|
| Pos. | Total Avg %15 | |
| 1= | Luxembourg | 99.0 |
| 1= | Oman | 99.0 |
| 1= | Niue | 99.0 |
| ... | ||
| 69 | Eritrea | 96.0 |
| 70 | Hong Kong | 96.0 |
| 71= | El Salvador | 95.7 |
| 71= | USA | 95.7 |
| 73 | Cayman Islands | 95.6 |
| 74= | Botswana | 95.6 |
| 74= | Uruguay | 95.6 |
| 74= | Spain | 95.6 |
| World Avg | 88.5 | |
| q=211. Also scored for 1980s-2020s. | ||
Averages by decade for the USA (for the ranks, lower is better):
| Infant DTP Immunizations (2020s) | 1980s Average | 1990s Average | 2000s Average | 2010s Average | 2020s Average |
|---|---|---|---|---|---|
| the USA: | 97.1 | 94.4 | 97.0 | 96.1 | 95.7 |
| World Rank: | 8th | ⇣ 60th | ⇡ 47th | ⇣ 79th | ⇡ 71st |
| World Avg: | 67.7 | 84.8 | 88.2 | 90.8 | 88.5 |
3.3. 7x Infant Immunizations (2011-2015)
| 7x Infant Immunizations (2011-2015) Higher is better17 | ||
|---|---|---|
| Pos. | 2015 Avg %17 | |
| 1= | Hungary | 99.0 |
| 1= | China | 99.0 |
| 3 | Uzbekistan | 98.9 |
| ... | ||
| 95 | Georgia | 93.1 |
| 96 | New Zealand | 92.9 |
| 97 | Nauru | 92.9 |
| 98 | USA | 92.8 |
| 99 | Latvia | 92.8 |
| 100 | Romania | 92.7 |
| 101 | France | 92.6 |
| 102= | El Salvador | 92.4 |
| World Avg | 88.3 | |
| q=194. | ||
3.4. Infant Mortality (2020s)
#alternative_medicine #health #pseudoscience
| Infant Mortality (2020s) Lower is better10 | ||
|---|---|---|
| Pos. | Total Per 100010 | |
| 1 | San Marino | 2.11 |
| 2 | Finland | 2.59 |
| 3 | Luxembourg | 2.60 |
| ... | ||
| 42 | Serbia | 6.52 |
| 43 | Malta | 6.58 |
| 44 | Bosnia & Herzegovina | 6.75 |
| 45 | USA | 6.83 |
| 46 | Turks & Caicos Islands | 6.89 |
| 47 | UAE | 7.69 |
| 48 | Bahrain | 7.92 |
| 49 | Chile | 7.93 |
| World Avg | 32.19 | |
| q=195. Also scored for 1960s-2020s. | ||
Averages by decade for the USA (for the ranks, lower is better):
| Infant Mortality (2020s) | 1960s Average | 1970s Average | 1980s Average | 1990s Average | 2000s Average | 2010s Average | 2020s Average |
|---|---|---|---|---|---|---|---|
| the USA: | 27.27 | 19.31 | 13.04 | 9.74 | 9.46 | 7.98 | 6.83 |
| World Rank: | 15th | 15th | ⇣ 22nd | ⇣ 30th | 30th | ⇣ 39th | ⇣ 45th |
| World Avg: | 142.42 | 111.96 | 83.04 | 64.84 | 63.22 | 45.87 | 32.19 |