Which are the Best Countries in Europe?
https://www.humantruth.info/europe.html
By Vexen Crabtree 2013
#austria #azerbaijan #bosnia_&_herzegovina #christianity #democracy_challenges #denmark #estonia #europe #finland #france #germany #germany_environmentalism #happiness #human_development #islam #judaism #malta #norway #poverty #religion #religion_in_europe #sweden #switzerland #ukraine
| Social & Moral Development Index1 | |||
|---|---|---|---|
| Pos. | Lower is better Avg Rank1 | ||
| 1 | Denmark | 27.2 | |
| 2 | Norway | 29.2 | |
| 3 | Sweden | 30.2 | |
| 4 | Netherlands | 30.8 | |
| 5 | Switzerland | 31.7 | |
| 6 | Finland | 32.8 | |
| 7 | Luxembourg | 36.6 | |
| 8 | Belgium | 37.6 | |
| 9 | Iceland | 38.0 | |
| 10 | Germany | 38.7 | |
| ... | |||
| 47 | Armenia | 86.7 | |
| 48 | Belarus | 88.4 | |
| 49 | Azerbaijan | 98.8 | |
| Europe Avg | 57.3 | ||
| World Avg | 89.2 | ||
| q=49. | |||
Human rights, equality and the rule of law define Europe, and European countries thusly make up most of the top countries on the Social and Moral Index. In "Universal Human Rights in Theory and Practice" by Jack Donnelly2 Europe is described as the leading practical example of the implementation of human rights, where they really are seen as intrinsic rights and not merely liberties3. The European Court of Human Rights is heavily over-subscribed and influential: it answers to the call of the citizens themselves, and only very rarely do governments ignore its rulings4.
There are 58 locations that fall within this category. By adding up all the known populations that fall within these locations, and summing their physical land areas, we can calculate population densities. Some islands and territories can end up being counted twice depending on how they are classified and divided up politically, but, mostly such errors involve only small populations. So, some data on this collection of countries in total:
- Population: 700.8m
- Land Area: 6 665 788km2
- Independent States: 48
- Other Territories: 10
- Compare to other regions of the world
- Summary Data
- Social and Moral Development
- Demographics and Migration
- Responsibility Towards The Environment
- Culture, Peace and Inequality
- Modernity and Learning
- Health
- Human Rights, Equality & Tolerance
- Religion and Beliefs
- The European Union (EU)
- Links
1. Summary Data
#economics #human_development #population #wealth
| Pos. | Population (2018) Population5 | Social & Moral Lower is better Avg Rank1 | Gross National Income (2021) Higher is better PPP $6 | UN HDI (2021) Higher is better Value6 | Land Area (2011) km27 | People Per km2 Lower is better | |
|---|---|---|---|---|---|---|---|
| 1 | Albania | 2.9m | 75.0 | $14 131 | 0.796 | 27 400 | 105 |
| 2 | Andorra | 77 006 | 64.8 | $51 167 | 0.858 | 470 | 164 |
| 3 | Armenia | 3.0m | 86.7 | $13 158 | 0.759 | 28 480 | 104 |
| 4 | Austria | 8.9m | 39.5 | $53 619 | 0.916 | 82 409 | 108 |
| 5 | Azerbaijan | 9.9m | 98.8 | $14 257 | 0.745 | 82 658 | 120 |
| 6 | Belarus | 9.5m | 88.4 | $18 849 | 0.808 | 202 910 | 47 |
| 7 | Belgium | 11.5m | 37.6 | $52 293 | 0.937 | 30 280 | 379 |
| 8 | Bosnia & Herzegovina | 3.3m | 83.4 | $15 242 | 0.780 | 51 000 | 65 |
| 9 | Bulgaria | 7.1m | 68.6 | $23 079 | 0.795 | 108 560 | 65 |
| 10 | Croatia | 4.2m | 63.6 | $30 132 | 0.858 | 55 960 | 74 |
| 11 | Cyprus | 1.2m | 53.1 | $38 188 | 0.896 | 9 240 | 129 |
| 12 | Czechia | 10.7m | 50.5 | $38 745 | 0.889 | 77 240 | 138 |
| 13 | Denmark | 5.8m | 27.2 | $60 365 | 0.948 | 42 430 | 136 |
| 14 | Estonia | 1.3m | 56.9 | $38 048 | 0.890 | 42 390 | 31 |
| 15 | Finland | 5.5m | 32.8 | $49 452 | 0.940 | 303 890 | 18 |
| 16 | France | 65.0m | 39.4 | $45 937 | 0.903 | 547 660 | 119 |
| 17 | Georgia | 4.0m | 83.0 | $14 664 | 0.802 | 69 490 | 58 |
| 18 | Germany | 83.1m | 38.7 | $54 534 | 0.942 | 348 570 | 238 |
| 19 | Greece | 10.5m | 55.7 | $29 002 | 0.887 | 128 900 | 82 |
| 20 | Hungary | 9.7m | 53.7 | $32 789 | 0.846 | 90 530 | 107 |
| 21 | Iceland | 0.3m | 38.0 | $55 782 | 0.959 | 100 250 | 3 |
| 22 | Ireland | 4.8m | 45.9 | $76 169 | 0.945 | 68 890 | 70 |
| 23 | Italy | 60.6m | 44.1 | $42 840 | 0.895 | 294 140 | 206 |
| 24 | Latvia | 1.9m | 62.1 | $32 803 | 0.863 | 62 200 | 31 |
| 25 | Liechtenstein | 37 910 | 42.7 | $146 830 | 0.935 | 160 | 237 |
| 26 | Lithuania | 2.8m | 64.2 | $37 931 | 0.875 | 62 674 | 45 |
| 27 | Luxembourg | 0.6m | 36.6 | $84 649 | 0.930 | 2 590 | 233 |
| 28 | Macedonia | 2.1m | 76.4 | $15 918 | 0.770 | 25 220 | 83 |
| 29 | Malta | 0.4m | 55.1 | $38 884 | 0.918 | 320 | 1 373 |
| 30 | Moldova | 4.1m | 81.1 | $14 875 | 0.767 | 32 854 | 123 |
| 31 | Monaco | 38 682 | 41.2 | 2 | 19 341 | ||
| 32 | Montenegro | 0.6m | 70.8 | $20 839 | 0.832 | 13 450 | 47 |
| 33 | Netherlands | 17.1m | 30.8 | $55 979 | 0.941 | 33 730 | 506 |
| 34 | Norway | 5.3m | 29.2 | $64 660 | 0.961 | 304 250 | 18 |
| 35 | Poland | 37.9m | 54.5 | $33 034 | 0.876 | 304 150 | 125 |
| 36 | Portugal | 10.3m | 46.1 | $33 155 | 0.866 | 91 470 | 112 |
| 37 | Romania | 19.5m | 70.2 | $30 027 | 0.821 | 230 160 | 85 |
| 38 | San Marino | 33 785 | 56.8 | $52 654 | 0.853 | 60 | 563 |
| 39 | Serbia | 8.8m | 74.8 | $19 123 | 0.802 | 87 460 | 101 |
| 40 | Slovakia | 5.5m | 55.6 | $30 690 | 0.848 | 48 088 | 113 |
| 41 | Slovenia | 2.1m | 45.5 | $39 746 | 0.918 | 20 140 | 103 |
| 42 | Spain | 46.7m | 43.5 | $38 354 | 0.905 | 498 800 | 94 |
| 43 | Sweden | 10.0m | 30.2 | $54 489 | 0.947 | 410 340 | 24 |
| 44 | Switzerland | 8.5m | 31.7 | $66 933 | 0.962 | 40 000 | 213 |
| 45 | Turkey | 82.3m | 83.0 | $31 033 | 0.838 | 769 630 | 107 |
| 46 | Ukraine | 44.2m | 82.2 | $13 256 | 0.773 | 579 320 | 76 |
| 47 | UK | 67.1m | 48.8 | $45 225 | 0.929 | 241 930 | 278 |
| 48 | Vatican City | 86.3 | |||||
| 49 | Isle of Man | 570 | |||||
| 50 | Faroe Islands | 1 396 | |||||
| 51 | Kosovo | 82.0 | 10 887 | ||||
| 52 | Channel Islands | 190 | |||||
| Europe Avg | 14.9m | 57.3 | $40 512 | 0.87 | 130 702 | 114 | |
| World Avg | 39.0m | 89.2 | $20 136 | 0.72 | 620 450 | 63 | |
| q=52. No data: 68 | |||||||
Not showing due to lack of data: Guernsey.
This page only shows places where the database has enough data to be able to come to reasonable conclusions about each place. The main focus is on nation states, but, some distinct external territories may be listed if the database has enough information about them. Averages are calculated from as many valid data points as possible, meaning, that some territories and locations that are not listed above may still be used to calculate some of the average values. Some calculations only use Independent State data - hover the cursor over values to see hints.
Links:
- Compare to other regions of the world
- Which are the Countries for International Contributions, Creativity, Peace and Inequality?
- The Population of the Earth
- Homosexuality in Animals and Humans
2. Social and Moral Development
#charitability #climate_change #culture #education #equality #freedom #gender_equality #health #human_development #human_rights #modernity #morals #peace #politics #prejudice #technology #the_environment #the_internet #tolerance
Here are each country's overall scores across the categories that make up the Social and Moral Development Index. This is followed by lists of how each country scores in each individual data set.
| Pos. | Social & Moral Lower is better Avg Rank1 | Responsibility Towards The Environment (2025) Lower is better Avg Rank9 | Culture, Peace & Inequality (2025) Lower is better Avg Rank10 | Modernity & Learning (2025) Lower is better Avg Rank11 | Health (2025) Lower is better Avg Rank12 | Human Rights, Equality & Tolerance (2025) Lower is better Avg Rank13 | |
|---|---|---|---|---|---|---|---|
| 1 | Denmark | 27.2 | 50.4 | 10.4 | 8.8 | 49.9 | 9.0 |
| 2 | Norway | 29.2 | 66.9 | 13.1 | 11.1 | 45.3 | 9.1 |
| 3 | Sweden | 30.2 | 71.8 | 16.7 | 10.4 | 45.1 | 7.5 |
| 4 | Netherlands | 30.8 | 71.1 | 11.8 | 13.1 | 50.0 | 8.6 |
| 5 | Switzerland | 31.7 | 45.0 | 16.4 | 11.2 | 51.5 | 25.9 |
| 6 | Finland | 32.8 | 71.9 | 12.2 | 6.1 | 52.3 | 17.7 |
| 7 | Luxembourg | 36.6 | 71.4 | 19.0 | 20.8 | 49.8 | 18.1 |
| 8 | Belgium | 37.6 | 75.3 | 24.2 | 11.4 | 54.1 | 18.7 |
| 9 | Iceland | 38.0 | 96.9 | 22.4 | 8.1 | 46.8 | 15.3 |
| 10 | Germany | 38.7 | 58.2 | 18.3 | 12.8 | 68.6 | 25.1 |
| 11 | France | 39.4 | 72.8 | 30.3 | 21.1 | 48.9 | 23.5 |
| 12 | Austria | 39.5 | 59.6 | 18.9 | 14.0 | 68.2 | 24.3 |
| 13 | Monaco | 41.2 | 92.1 | 30.0 | 10.3 | 61.1 | |
| 14 | Liechtenstein | 42.7 | 56.8 | 31.7 | 30.1 | 55.3 | |
| 15 | Spain | 43.5 | 59.5 | 36.9 | 22.2 | 62.5 | 28.7 |
| 16 | Italy | 44.1 | 63.1 | 39.3 | 27.5 | 57.8 | 30.0 |
| 17 | Slovenia | 45.5 | 82.1 | 29.0 | 24.8 | 61.9 | 30.5 |
| 18 | Ireland | 45.9 | 63.1 | 20.2 | 44.4 | 68.9 | 29.7 |
| 19 | Portugal | 46.1 | 58.0 | 38.1 | 25.5 | 62.1 | 36.4 |
| 20 | UK | 48.8 | 74.4 | 25.3 | 58.5 | 64.1 | 26.2 |
| 21 | Czechia | 50.5 | 89.3 | 36.5 | 19.7 | 67.0 | 38.8 |
| 22 | Cyprus | 53.1 | 64.8 | 40.0 | 45.4 | 64.6 | 49.2 |
| 23 | Hungary | 53.7 | 65.8 | 38.3 | 23.4 | 72.0 | 59.0 |
| 24 | Poland | 54.5 | 81.0 | 41.2 | 26.2 | 71.1 | 47.8 |
| 25 | Malta | 55.1 | 92.2 | 31.8 | 41.0 | 71.3 | 38.9 |
| 26 | Slovakia | 55.6 | 80.8 | 43.0 | 30.0 | 72.8 | 47.1 |
| 27 | Greece | 55.7 | 61.4 | 54.8 | 37.4 | 67.2 | 51.4 |
| 28 | San Marino | 56.8 | 134.9 | 40.9 | 42.3 | 52.9 | |
| 29 | Estonia | 56.9 | 97.0 | 41.4 | 22.3 | 83.2 | 41.0 |
| 30 | Latvia | 62.1 | 77.7 | 52.2 | 30.1 | 85.5 | 55.2 |
| 31 | Croatia | 63.6 | 88.5 | 51.6 | 43.9 | 76.3 | 55.7 |
| 32 | Lithuania | 64.2 | 89.5 | 52.9 | 33.2 | 85.5 | 51.1 |
| 33 | Andorra | 64.8 | 136.3 | 53.0 | 63.1 | 50.2 | |
| 34 | Bulgaria | 68.6 | 75.8 | 60.4 | 45.4 | 83.0 | 68.8 |
| 35 | Romania | 70.2 | 73.8 | 62.2 | 38.7 | 87.5 | 76.6 |
| 36 | Montenegro | 70.8 | 97.3 | 72.6 | 49.7 | 73.5 | 64.3 |
| 37 | Serbia | 74.8 | 104.8 | 70.1 | 45.8 | 84.1 | 67.5 |
| 38 | Albania | 75.0 | 91.5 | 63.3 | 73.0 | 71.0 | 87.5 |
| 39 | Macedonia | 76.4 | 86.9 | 74.4 | 65.1 | 78.5 | 78.3 |
| 40 | Moldova | 81.1 | 92.1 | 65.3 | 60.7 | 97.3 | 84.3 |
| 41 | Kosovo | 82.0 | 80.1 | 31.9 | 102.3 | 96.1 | |
| 42 | Ukraine | 82.2 | 94.8 | 84.5 | 49.1 | 98.4 | 73.9 |
| 43 | Turkey | 83.0 | 75.0 | 85.8 | 50.4 | 94.2 | 99.7 |
| 44 | Georgia | 83.0 | 83.6 | 86.9 | 60.6 | 94.8 | 83.0 |
| 45 | Bosnia & Herzegovina | 83.4 | 103.5 | 73.7 | 57.6 | 90.7 | 89.5 |
| 46 | Vatican City | 86.3 | 138.3 | 113.6 | |||
| 47 | Armenia | 86.7 | 108.2 | 82.4 | 65.6 | 85.3 | 100.8 |
| 48 | Belarus | 88.4 | 116.0 | 84.8 | 48.5 | 80.2 | 121.5 |
| 49 | Azerbaijan | 98.8 | 101.2 | 102.1 | 65.5 | 101.6 | 123.0 |
| Europe Avg | 57.3 | 82.54 | 46.24 | 34.74 | 68.59 | 52.39 | |
| World Avg | 89.2 | 84.93 | 80.47 | 84.96 | 97.39 | 90.04 | |
| q=49. | |||||||
The Social and Moral Development Index concentrates on moral issues and human rights, violence, public health, equality, tolerance, freedom and effectiveness in climate change mitigation and environmentalism, and on some technological issues. A country scores higher for achieving well in those areas, and for sustaining that achievement in the long term. Those countries towards the top of this index can truly said to be setting good examples and leading humankind onwards into a bright, humane, and free future. See: Which are the Best Countries in the World? The Social and Moral Development Index.
For more, see:
3. Demographics and Migration
#birth_control #demographics #emigration #europe #europe_migration #health #immigration #life_expectancy #longevity #migration #overpopulation #population
Population:
| Pos. | Population (2018) Population5 | Life Expectancy (2021) Higher is better Years6 | Fertility Rate (2022) 2.0 is best14 | Old-Age Dependency Ratio (2016) Lower is better Per 10015 | |
|---|---|---|---|---|---|
| 1 | Albania | 2.9m | 76.5 | 1.38 | 31.8 |
| 2 | Andorra | 77 006 | 80.4 | ||
| 3 | Armenia | 3.0m | 72.0 | 1.58 | 28.7 |
| 4 | Austria | 8.9m | 81.6 | 1.41 | 40.5 |
| 5 | Azerbaijan | 9.9m | 69.4 | 1.67 | 18.7 |
| 6 | Belarus | 9.5m | 72.4 | 1.50 | 30.3 |
| 7 | Belgium | 11.5m | 81.9 | 1.53 | 38.1 |
| 8 | Bosnia & Herzegovina | 3.3m | 75.3 | 1.35 | 37.3 |
| 9 | Bulgaria | 7.1m | 71.8 | 1.78 | 37.0 |
| 10 | Croatia | 4.2m | 77.6 | 1.53 | 39.7 |
| 11 | Cyprus | 1.2m | 81.2 | 1.31 | 26.9 |
| 12 | Czechia | 10.7m | 77.7 | 1.62 | 36.1 |
| 13 | Denmark | 5.8m | 81.4 | 1.55 | 37.1 |
| 14 | Estonia | 1.3m | 77.1 | 1.41 | 37.9 |
| 15 | Finland | 5.5m | 82.0 | 1.32 | 43.3 |
| 16 | France | 65.0m | 82.5 | 1.79 | 40.5 |
| 17 | Georgia | 4.0m | 71.7 | 2.06 | 29.7 |
| 18 | Germany | 83.1m | 80.6 | 1.46 | 47.7 |
| 19 | Greece | 10.5m | 80.1 | 1.43 | 41.3 |
| 20 | Hungary | 9.7m | 74.5 | 1.52 | 32.9 |
| 21 | Iceland | 0.3m | 82.7 | 1.59 | 32.5 |
| 22 | Ireland | 4.8m | 82.0 | 1.70 | 29.2 |
| 23 | Italy | 60.6m | 82.9 | 1.24 | 48.6 |
| 24 | Latvia | 1.9m | 73.6 | 1.47 | 36.7 |
| 25 | Liechtenstein | 37 910 | 83.3 | 1.47 | |
| 26 | Lithuania | 2.8m | 73.7 | 1.27 | 36.0 |
| 27 | Luxembourg | 0.6m | 82.6 | 1.31 | 28.3 |
| 28 | Macedonia | 2.1m | 73.8 | 1.60 | 27.7 |
| 29 | Malta | 0.4m | 83.8 | 1.15 | 39.9 |
| 30 | Moldova | 4.1m | 68.8 | 1.80 | 24.7 |
| 31 | Monaco | 38 682 | 85.9 | ||
| 32 | Montenegro | 0.6m | 76.3 | 1.80 | 30.0 |
| 33 | Netherlands | 17.1m | 81.7 | 1.49 | 41.9 |
| 34 | Norway | 5.3m | 83.2 | 1.41 | 32.2 |
| 35 | Poland | 37.9m | 76.5 | 1.26 | 36.3 |
| 36 | Portugal | 10.3m | 81.0 | 1.43 | 44.7 |
| 37 | Romania | 19.5m | 74.2 | 1.81 | 33.6 |
| 38 | San Marino | 33 785 | 80.9 | ||
| 39 | Serbia | 8.8m | 74.2 | 1.63 | 32.7 |
| 40 | Slovakia | 5.5m | 74.9 | 1.57 | 31.6 |
| 41 | Slovenia | 2.1m | 80.7 | 1.55 | 42.7 |
| 42 | Spain | 46.7m | 83.0 | 1.16 | 41.4 |
| 43 | Sweden | 10.0m | 83.0 | 1.52 | 37.0 |
| 44 | Switzerland | 8.5m | 84.0 | 1.39 | 38.3 |
| 45 | Turkey | 82.3m | 76.0 | 1.88 | 18.0 |
| 46 | Ukraine | 44.2m | 71.6 | 1.27 | 30.8 |
| 47 | UK | 67.1m | 80.7 | 1.57 | 35.0 |
| 48 | Isle of Man | 1.57 | |||
| 49 | Gibraltar | 1.84 | |||
| 50 | Faroe Islands | 2.05 | |||
| 51 | Kosovo | 1.51 | |||
| 52 | Channel Islands | 1.47 | |||
| Europe Avg | 14.9m | 78.36 | 1.53 | 35.0 | |
| World Avg | 39.0m | 71.28 | 2.47 | 18.3 | |
| q=52. No data: 616 | |||||
Migration:
Some tiny countries in Europe are mostly comprised of immigrants. The countries in Europe with the highest percent of immigrants in their populations are Liechtenstein (65.1%), Monaco (54.9%) and Andorra (53.3%), although the average for Europe is 14%. Of the large countries with more than a million in their population, the highest proportion of immigrants can be found in Switzerland (29.6%), Austria (19%) and Sweden (17.6%). The highest rates of emigration are seen in Monaco (56.3%), Albania (45.4%) and Bosnia & Herzegovina (38.9%), whilst the continental average of emigrants for a country is 13%.
For full commentary and data, see:
4. Responsibility Towards The Environment
#biodiversity #climate_change #deforestation #energy #environmentalism #food #internationalism #meat #over-exploitation #sustainability #the_environment #veganism #vegetarianism
We have known for a long term that we must protect the environment from habitation destruction, over-exploitation, pollution, and the emissions that cause climate change. In 1998, Greenpeace wrote that "Environment can no longer be meaningfully separated from health, quality of life, democracy, education, economy or trade"17. What countries have been doing the right thing, via legislation and national culture? All countries' current and historical approach towards the environment is gauged via 21 datasets, including multiple decades of data on its forested percent change 2000-2020, its environmental performance, energy to GDP efficiency, its sign-up rate to major international accords on protecting the environment, the rate of rational beliefs on the environment in the population, reducing annual meat consumption per person and its score on the Green Future Index.
The countries that do the best (Sri Lanka, Uruguay and Switzerland) tend to have avoided the excesses of early industrial countries, and have not yet repeated the same mistakes of environmental destruction - at least, not on the same scale. The regions with the best average results per country are Central America, South America and Scandinavia. The worst are Eritrea, The Vatican City and Timor-Leste (E. Timor), and the worst regions Micronesia, Australasia and Melanesia.
For more, see:
| Pos. | Forest Area Change 2000-2020 Higher is better18 | Environmental Performance (2018) Higher is better19 | Energy to GDP Efficiency (2022) Lower is better Avg20 | International Accords on the Environment Higher is better Avg Rate | Rational Beliefs on the Environment (2011) Higher is better %21 | Meat Consumption (2021) Lower is better kg22 | Green Future Index (2023) Higher is better Score23 | |
|---|---|---|---|---|---|---|---|---|
| 1 | Albania | 2.5% | 65.5 | 1.08 | 47% | 9.4% | 52.0 | |
| 2 | Andorra | 0.0% | 22% | |||||
| 3 | Armenia | -1.3% | 62.1 | 1.42 | 72% | 25.3% | 60.0 | |
| 4 | Austria | 1.6% | 79.0 | 1.04 | 70% | 31.8% | 76.4 | 5.4 |
| 5 | Azerbaijan | 14.2% | 62.3 | 1.18 | 66% | 31.7% | 37.1 | |
| 6 | Belarus | 5.9% | 65.0 | 1.64 | 76% | 23.7% | 88.9 | |
| 7 | Belgium | 3.3% | 77.4 | 1.49 | 66% | 26.9% | 66.2 | 5.8 |
| 8 | Bosnia & Herzegovina | 3.6% | 41.8 | 1.60 | 45% | 44.0% | 46.8 | |
| 9 | Bulgaria | 14.9% | 67.9 | 1.63 | 57% | 32.5% | 61.8 | 5.3 |
| 10 | Croatia | 2.9% | 65.5 | 1.00 | 51% | 37.8% | 90.8 | |
| 11 | Cyprus | 0.5% | 72.6 | 0.92 | 71% | 71.0% | 75.8 | |
| 12 | Czechia | 1.5% | 67.7 | 1.36 | 58% | 16.0% | 82.4 | 5.0 |
| 13 | Denmark | 9.8% | 81.6 | 0.65 | 73% | 14.9% | 70.5 | 6.3 |
| 14 | Estonia | 8.7% | 64.3 | 1.56 | 80% | 15.9% | 72.1 | |
| 15 | Finland | -0.2% | 78.6 | 1.44 | 79% | 22.9% | 74.0 | 6.7 |
| 16 | France | 12.5% | 84.0 | 0.95 | 67% | 38.4% | 86.1 | 6.0 |
| 17 | Georgia | 2.2% | 55.7 | 1.22 | 79% | 31.9% | 37.8 | |
| 18 | Germany | 0.6% | 78.4 | 0.91 | 76% | 36.1% | 76.6 | 5.9 |
| 19 | Greece | 8.4% | 73.6 | 1.20 | 62% | 77.6% | 76.8 | 5.6 |
| 20 | Hungary | 6.8% | 65.0 | 1.01 | 66% | 38.0% | 82.1 | 5.1 |
| 21 | Iceland | 64.7% | 78.6 | 4.01 | 53% | 13.1% | 83.6 | 6.7 |
| 22 | Ireland | 22.8% | 78.8 | 0.62 | 59% | 27.9% | 80.2 | 5.7 |
| 23 | Italy | 13.8% | 77.0 | 0.84 | 66% | 49.6% | 74.3 | 5.7 |
| 24 | Latvia | 5.2% | 66.1 | 0.81 | 81% | 19.5% | 74.0 | |
| 25 | Liechtenstein | 0.0% | 66% | |||||
| 26 | Lithuania | 8.9% | 69.3 | 0.83 | 75% | 25.6% | 83.6 | |
| 27 | Luxembourg | 2.3% | 79.1 | 1.16 | 68% | 33.3% | 85.8 | 5.6 |
| 28 | Macedonia | 4.6% | 61.1 | 1.04 | 74% | 30.1% | 41.0 | |
| 29 | Malta | 31.4% | 80.9 | 2.36 | 55% | 57.3% | 67.8 | |
| 30 | Moldova | 11.9% | 52.0 | 1.88 | 50% | 40.4% | 61.9 | |
| 31 | Monaco | 0.0% | 60% | |||||
| 32 | Montenegro | 32.1% | 61.3 | 1.03 | 72% | 35.9% | 88.4 | |
| 33 | Netherlands | 2.8% | 75.5 | 1.17 | 68% | 23.0% | 63.8 | 6.2 |
| 34 | Norway | 0.6% | 77.5 | 1.19 | 81% | 20.5% | 74.7 | 6.4 |
| 35 | Poland | 4.6% | 64.1 | 1.01 | 57% | 23.8% | 89.3 | 5.4 |
| 36 | Portugal | 1.0% | 71.9 | 0.95 | 69% | 55.8% | 94.6 | 5.5 |
| 37 | Romania | 8.7% | 64.8 | 0.75 | 57% | 33.4% | 67.1 | 4.7 |
| 38 | San Marino | 0.0% | 26% | |||||
| 39 | Serbia | 10.6% | 57.5 | 1.79 | 41% | 41.1% | 77.6 | |
| 40 | Slovakia | 1.3% | 70.6 | 1.26 | 57% | 31.1% | 63.5 | 4.8 |
| 41 | Slovenia | 0.4% | 67.6 | 1.15 | 56% | 45.1% | 61.2 | |
| 42 | Spain | 8.6% | 78.4 | 0.98 | 66% | 44.8% | 100.3 | 5.9 |
| 43 | Sweden | -0.7% | 80.5 | 1.30 | 83% | 24.3% | 66.9 | 6.3 |
| 44 | Switzerland | 6.0% | 87.4 | 0.55 | 78% | 68.0 | 5.4 | |
| 45 | Turkey | 10.0% | 53.0 | 0.86 | 47% | 47.4% | 43.0 | 3.8 |
| 46 | Ukraine | 1.9% | 52.9 | 2.11 | 80% | 41.5% | 48.5 | 4.4 |
| 47 | UK | 7.8% | 79.9 | 0.80 | 70% | 22.6% | 82.3 | 6.1 |
| 48 | Vatican City | 0.0% | 10% | |||||
| 49 | Guernsey | 82.6% | ||||||
| 50 | Isle of Man | 0.0% | ||||||
| 51 | Jersey | 0.0% | ||||||
| 52 | Gibraltar | 0.0% | ||||||
| 53 | Faroe Islands | 0.0% | ||||||
| 54 | Svalbard | 0.0% | ||||||
| Europe Avg | 8.2% | 69.6 | 1.25 | 62.7% | 33.6% | 71.1 | 5.6 | |
| World Avg | -0.1% | 56.4 | 1.23 | 57.5% | 39.9% | 52.5 | 4.8 | |
| q=54. No data: 424 | ||||||||
 In the 1500s, Germany pioneered forestry management techniques which spread to the rest of Europe, especially from the 1700s25 with the publication of Hans Carl von Carlowitz's Sylvicultura Oeconomica in 1713.
“As a result, Europe's total area of forest, after declining steadily ever since the origins of European agriculture 9,000 years ago, has actually been increasing since around 1800.”
The Green Futures Index was very positive about Europe's role, in modern times, in protecting the climate. "Several European countries have made significant policy and energy infrastructure investment gains including Greece, which has earmarked more than 30% of its €18 billion EU recovery fund package for clean energy transition efforts" (GFI 2022)26. The EU specifically gains a lot of support from the GFI:
“EU members collectively benefit from its policy resolutions to speed up low-carbon societal and economic activities", for example the current European Commission drive to boost biodiversity via the European Green Deal; this acclaim comes from the Green Futures Index (GFI). "The political will and coordination of the EU is creating a virtuous cycle that drives climate action. Eight out of the top 10 nations in the climate policy pillar [of GFI statistics groupings] are EU states, led by Denmark, which has one of the most aggressive decarbonization policy positions in the world.”
GFI (2023)27
EU Swimming Water Quality in 2020 (Best: Cyprus and Austria; Worst: UK and Poland)
#EU_public_health #human_development #pollution #religion #sewage #UK #uk_public_health #water #water_pollution
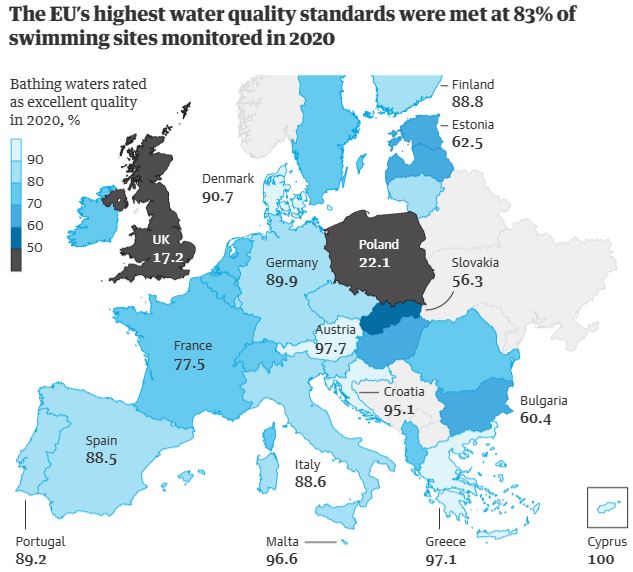
Source:The Guardian (2021)28
Swimming sites are directly linked to overall water system health, especially river health. The EU's river water-quality standards stipulate that water companies must treat sewage rather than dump it in rivers and oceans29 where it impacts on all neighbouring countries. Since its adoption in 1991, over 90% of urban wastewater has come to be treated throughout the EU, and 'the quality of European rivers, lakes and seas has dramatically improved'30. The UK never done well28, however, and the International Water Resources Association's Callum Clench recalls that the UK was regularly fined for not meeting those standards and he worries about further decline now that the UK has left the EU29 and its Conservative Party Government feels freer to do less, and is actively removing even more environmental legislation.
For more, see: UK River and Beach Pollution from Sewage.
5. Culture, Peace and Inequality
#capitalism #charity #corruption #culture #economics #equality #extremism #freedom #happiness #health #human_development #inequality #internationalism #life_expectancy #morals #peace #politics #poverty #religious_violence #social_development #terrorism
This is the final pillar of the Social and Moral Development Index; it has 39 datasets, including multiple decades of data on resisting corruption, Creativity and Culture, overall happiness, Open Trading, Aid and Development, passport utility (so far), personal financial stability, World Giving Index, its Global Peace Index rating, Peacekeeping and Security, Refugees and UN Treaties, the impact of terrorism, poverty (so far), life expectancy inequality, Income Inequality (Gini Coefficient) and Multidimensional Poverty.
For more, see:
National Culture:
Europe sets the best examples in the world on how to fight corruption; no others are as effective at doing so than the Scandinavian countries of Denmark and Finland, with Norway and Sweden not far behind, according to Transparency International's 2022 data31. The places in Europe most susceptible to corruption are Azerbaijan, Ukraine and Bosnia & Herzegovina.
| Pos. | Corruption (2022) Higher is better Points32 | Creativity & Culture (2017) Lower is better Rank33 | Happiness (2024) Higher is better Score34 | Open Trading, Aid & Development (2017) Lower is better Rank33 | Passport Reach (2020s) Higher is better Q35 | Personal Financial Stability in the 2020s Higher is better Score36 | World Giving Index (2022) Higher is better %37 | |
|---|---|---|---|---|---|---|---|---|
| 1 | Albania | 36.0 | 78 | 5.4 | 15 | 117.0 | 7.37 | 34.0 |
| 2 | Andorra | 169.0 | ||||||
| 3 | Armenia | 46.0 | 103 | 5.5 | 48 | 65.7 | 7.31 | 29.0 |
| 4 | Austria | 71.0 | 7 | 6.8 | 13 | 188.7 | 8.59 | 45.0 |
| 5 | Azerbaijan | 23.0 | 139 | 4.9 | 86 | 69.3 | 5.83 | |
| 6 | Belarus | 39.0 | 95 | 84 | 78.5 | 6.09 | ||
| 7 | Belgium | 73.0 | 1 | 6.9 | 7 | 187.2 | 8.51 | 21.0 |
| 8 | Bosnia & Herzegovina | 34.0 | 69 | 6.1 | 45 | 119.0 | 5.42 | 44.0 |
| 9 | Bulgaria | 43.0 | 39 | 5.6 | 39 | 174.5 | 7.04 | 41.0 |
| 10 | Croatia | 50.0 | 38 | 5.9 | 10 | 176.2 | 7.49 | 37.0 |
| 11 | Cyprus | 52.0 | 44 | 5.9 | 38 | 177.0 | 7.97 | 40.0 |
| 12 | Czechia | 56.0 | 9 | 6.8 | 98 | 185.7 | 8.19 | 48.0 |
| 13 | Denmark | 90.0 | 6 | 7.5 | 2 | 188.7 | 9.06 | 46.0 |
| 14 | Estonia | 74.0 | 3 | 6.4 | 37 | 182.2 | 7.94 | 40.0 |
| 15 | Finland | 87.0 | 13 | 7.7 | 9 | 189.5 | 8.96 | 37.0 |
| 16 | France | 72.0 | 14 | 6.6 | 17 | 188.5 | 8.17 | 32.0 |
| 17 | Georgia | 56.0 | 109 | 5.4 | 11 | 117.5 | 7.14 | 31.0 |
| 18 | Germany | 79.0 | 15 | 6.8 | 14 | 190.3 | 8.64 | 41.0 |
| 19 | Greece | 52.0 | 47 | 5.8 | 50 | 186.0 | 7.62 | 32.0 |
| 20 | Hungary | 42.0 | 19 | 5.9 | 23 | 184.3 | 7.42 | 40.0 |
| 21 | Iceland | 74.0 | 37 | 7.5 | 105 | 181.2 | 8.76 | 46.0 |
| 22 | Ireland | 77.0 | 8 | 6.9 | 1 | 188.2 | 8.46 | 49.0 |
| 23 | Italy | 56.0 | 26 | 6.4 | 36 | 189.7 | 7.86 | 29.0 |
| 24 | Latvia | 59.0 | 17 | 6.2 | 80 | 182.2 | 7.76 | 29.0 |
| 25 | Liechtenstein | 179.2 | ||||||
| 26 | Lithuania | 62.0 | 23 | 6.8 | 124 | 183.0 | 7.58 | 37.0 |
| 27 | Luxembourg | 77.0 | 10 | 7.1 | 56 | 189.3 | 8.82 | |
| 28 | Macedonia | 40.0 | 55 | 5.5 | 74 | 125.8 | 6.16 | 45.0 |
| 29 | Malta | 51.0 | 28 | 6.3 | 42 | 185.7 | 8.15 | 45.0 |
| 30 | Moldova | 39.0 | 46 | 5.8 | 22 | 120.7 | 6.34 | 37.0 |
| 31 | Monaco | 175.3 | ||||||
| 32 | Montenegro | 45.0 | 61 | 5.9 | 71 | 124.8 | 7.25 | 34.0 |
| 33 | Netherlands | 80.0 | 2 | 7.3 | 4 | 188.3 | 8.96 | 46.0 |
| 34 | Norway | 84.0 | 22 | 7.3 | 8 | 186.8 | 8.57 | 45.0 |
| 35 | Poland | 55.0 | 21 | 6.7 | 46 | 184.0 | 6.90 | 47.0 |
| 36 | Portugal | 62.0 | 12 | 6.0 | 21 | 187.7 | 8.42 | 26.0 |
| 37 | Romania | 46.0 | 31 | 6.6 | 81 | 82.7 | 7.72 | 30.0 |
| 38 | San Marino | 169.5 | ||||||
| 39 | Serbia | 36.0 | 33 | 6.6 | 6 | 136.2 | 6.33 | 46.0 |
| 40 | Slovakia | 53.0 | 20 | 6.2 | 142 | 182.8 | 7.68 | 41.0 |
| 41 | Slovenia | 56.0 | 16 | 6.8 | 77 | 182.2 | 7.83 | 39.0 |
| 42 | Spain | 60.0 | 30 | 6.5 | 34 | 189.8 | 8.22 | 32.0 |
| 43 | Sweden | 83.0 | 5 | 7.3 | 3 | 188.3 | 8.82 | 42.0 |
| 44 | Switzerland | 82.0 | 4 | 6.9 | 5 | 186.8 | 9.00 | 37.0 |
| 45 | Turkey | 36.0 | 75 | 5.3 | 40 | 112.2 | 4.82 | 40.0 |
| 46 | Ukraine | 33.0 | 62 | 4.7 | 72 | 140.8 | 5.28 | 49.0 |
| 47 | UK | 73.0 | 11 | 6.7 | 35 | 186.8 | 8.58 | 47.0 |
| 48 | Vatican City | 154.2 | ||||||
| 49 | Kosovo | 41.0 | 6.7 | 53.2 | 43.0 | |||
| Europe Avg | 57.61 | 35.0 | 6.37 | 42.6 | 160.7 | 7.65 | 39.0 | |
| World Avg | 42.98 | 82.0 | 5.58 | 82.0 | 108.8 | 6.46 | 39.6 | |
| q=49. No data: 938 | ||||||||
9.1. Unhappiness and Extremist Voting in Europe39
#human_development #religion #USA
Statistical analysis for the "World Happiness Report" by Helliwell et al. (2025)40 shows that in Europe (and the USA), there has been an overall decline in happiness over the years and since the 2000s in particular, they have been causing a rise in voting habits towards more extreme political parties41. Social Trust is a linked feature during this decline; those who trust others tend to vote for far-left, and those who distrust others go far-right41. In addition, as rich countries are often very divided in terms of incomes (economic inequality), there is a unfortunate trend for the poor-and-poorly-educated to vote for more extreme right-wing parties: those are the very parties that engender and permit economic inequality, whereas the better-educated tend to vote further to left, towards the less popular parties that intend to distribute wealth more equally.41. In short, reduced happiness locks-in some poor voting choices, and political parties (especially those on the right, economically) are all-too-happy to capitalize on this, causing further decline in national stability and happiness.
Peace Versus Instability:
| Pos. | Global Peace Index (2023) Lower is better Score42 | Peacekeeping & Security (2017) Lower is better Rank33 | Refugees & UN Treaties (2017) Lower is better Rank33 | Impact of Terrorism (2019) Lower is better Score43 | |
|---|---|---|---|---|---|
| 1 | Albania | 1.75 | 80 | 74 | 0.42 |
| 2 | Armenia | 1.93 | 136 | 104 | 1.17 |
| 3 | Austria | 1.32 | 65 | 1 | 1.66 |
| 4 | Azerbaijan | 2.10 | 42 | 132 | 0.70 |
| 5 | Belarus | 2.25 | 132 | 92 | |
| 6 | Belgium | 1.52 | 109 | 13 | 3.64 |
| 7 | Bosnia & Herzegovina | 1.89 | 149 | 35 | 1.39 |
| 8 | Bulgaria | 1.64 | 69 | 32 | 0.37 |
| 9 | Croatia | 1.45 | 146 | 58 | 0.00 |
| 10 | Cyprus | 1.90 | 73 | 17 | 0.42 |
| 11 | Czechia | 1.38 | 98 | 48 | 0.87 |
| 12 | Denmark | 1.31 | 64 | 9 | 0.96 |
| 13 | Estonia | 1.56 | 93 | 72 | 0.12 |
| 14 | Finland | 1.40 | 52 | 8 | 2.03 |
| 15 | France | 1.94 | 53 | 16 | 5.01 |
| 16 | Georgia | 2.07 | 79 | 101 | 1.34 |
| 17 | Germany | 1.46 | 37 | 2 | 4.25 |
| 18 | Greece | 1.89 | 115 | 31 | 4.17 |
| 19 | Hungary | 1.51 | 17 | 43 | 0.18 |
| 20 | Iceland | 1.12 | 77 | 42 | 0.03 |
| 21 | Ireland | 1.31 | 50 | 21 | 2.69 |
| 22 | Italy | 1.66 | 55 | 14 | 3.11 |
| 23 | Latvia | 1.58 | 104 | 70 | 0.23 |
| 24 | Lithuania | 1.67 | 99 | 56 | 0.46 |
| 25 | Luxembourg | 100 | 20 | ||
| 26 | Macedonia | 1.71 | 135 | 54 | 0.30 |
| 27 | Malta | 124 | 5 | ||
| 28 | Moldova | 1.87 | 9 | 64 | 0.12 |
| 29 | Montenegro | 1.77 | 128 | 41 | 1.00 |
| 30 | Netherlands | 1.49 | 27 | 3 | 2.35 |
| 31 | Norway | 1.55 | 51 | 7 | 0.08 |
| 32 | Poland | 1.63 | 107 | 24 | 0.48 |
| 33 | Portugal | 1.33 | 133 | 28 | 0.00 |
| 34 | Romania | 1.65 | 58 | 36 | 0.00 |
| 35 | Serbia | 1.92 | 84 | 45 | 0.12 |
| 36 | Slovakia | 1.58 | 113 | 52 | 0.06 |
| 37 | Slovenia | 1.33 | 160 | 18 | 0.00 |
| 38 | Spain | 1.65 | 71 | 15 | 3.35 |
| 39 | Sweden | 1.63 | 67 | 4 | 3.45 |
| 40 | Switzerland | 1.34 | 44 | 10 | 0.19 |
| 41 | Turkey | 2.80 | 78 | 39 | 6.53 |
| 42 | Ukraine | 3.04 | 108 | 57 | 5.55 |
| 43 | UK | 1.69 | 48 | 12 | 5.41 |
| 44 | Kosovo | 1.95 | 2.26 | ||
| Europe Avg | 1.70 | 84.6 | 37.8 | 1.62 | |
| World Avg | 2.07 | 82.0 | 82.0 | 2.78 | |
| q=44. No data: 1444 | |||||
Europe was the first continent to move towards the modern era of state-based democratic security as part of a long-term trend of peaceability regulated by state interventions.
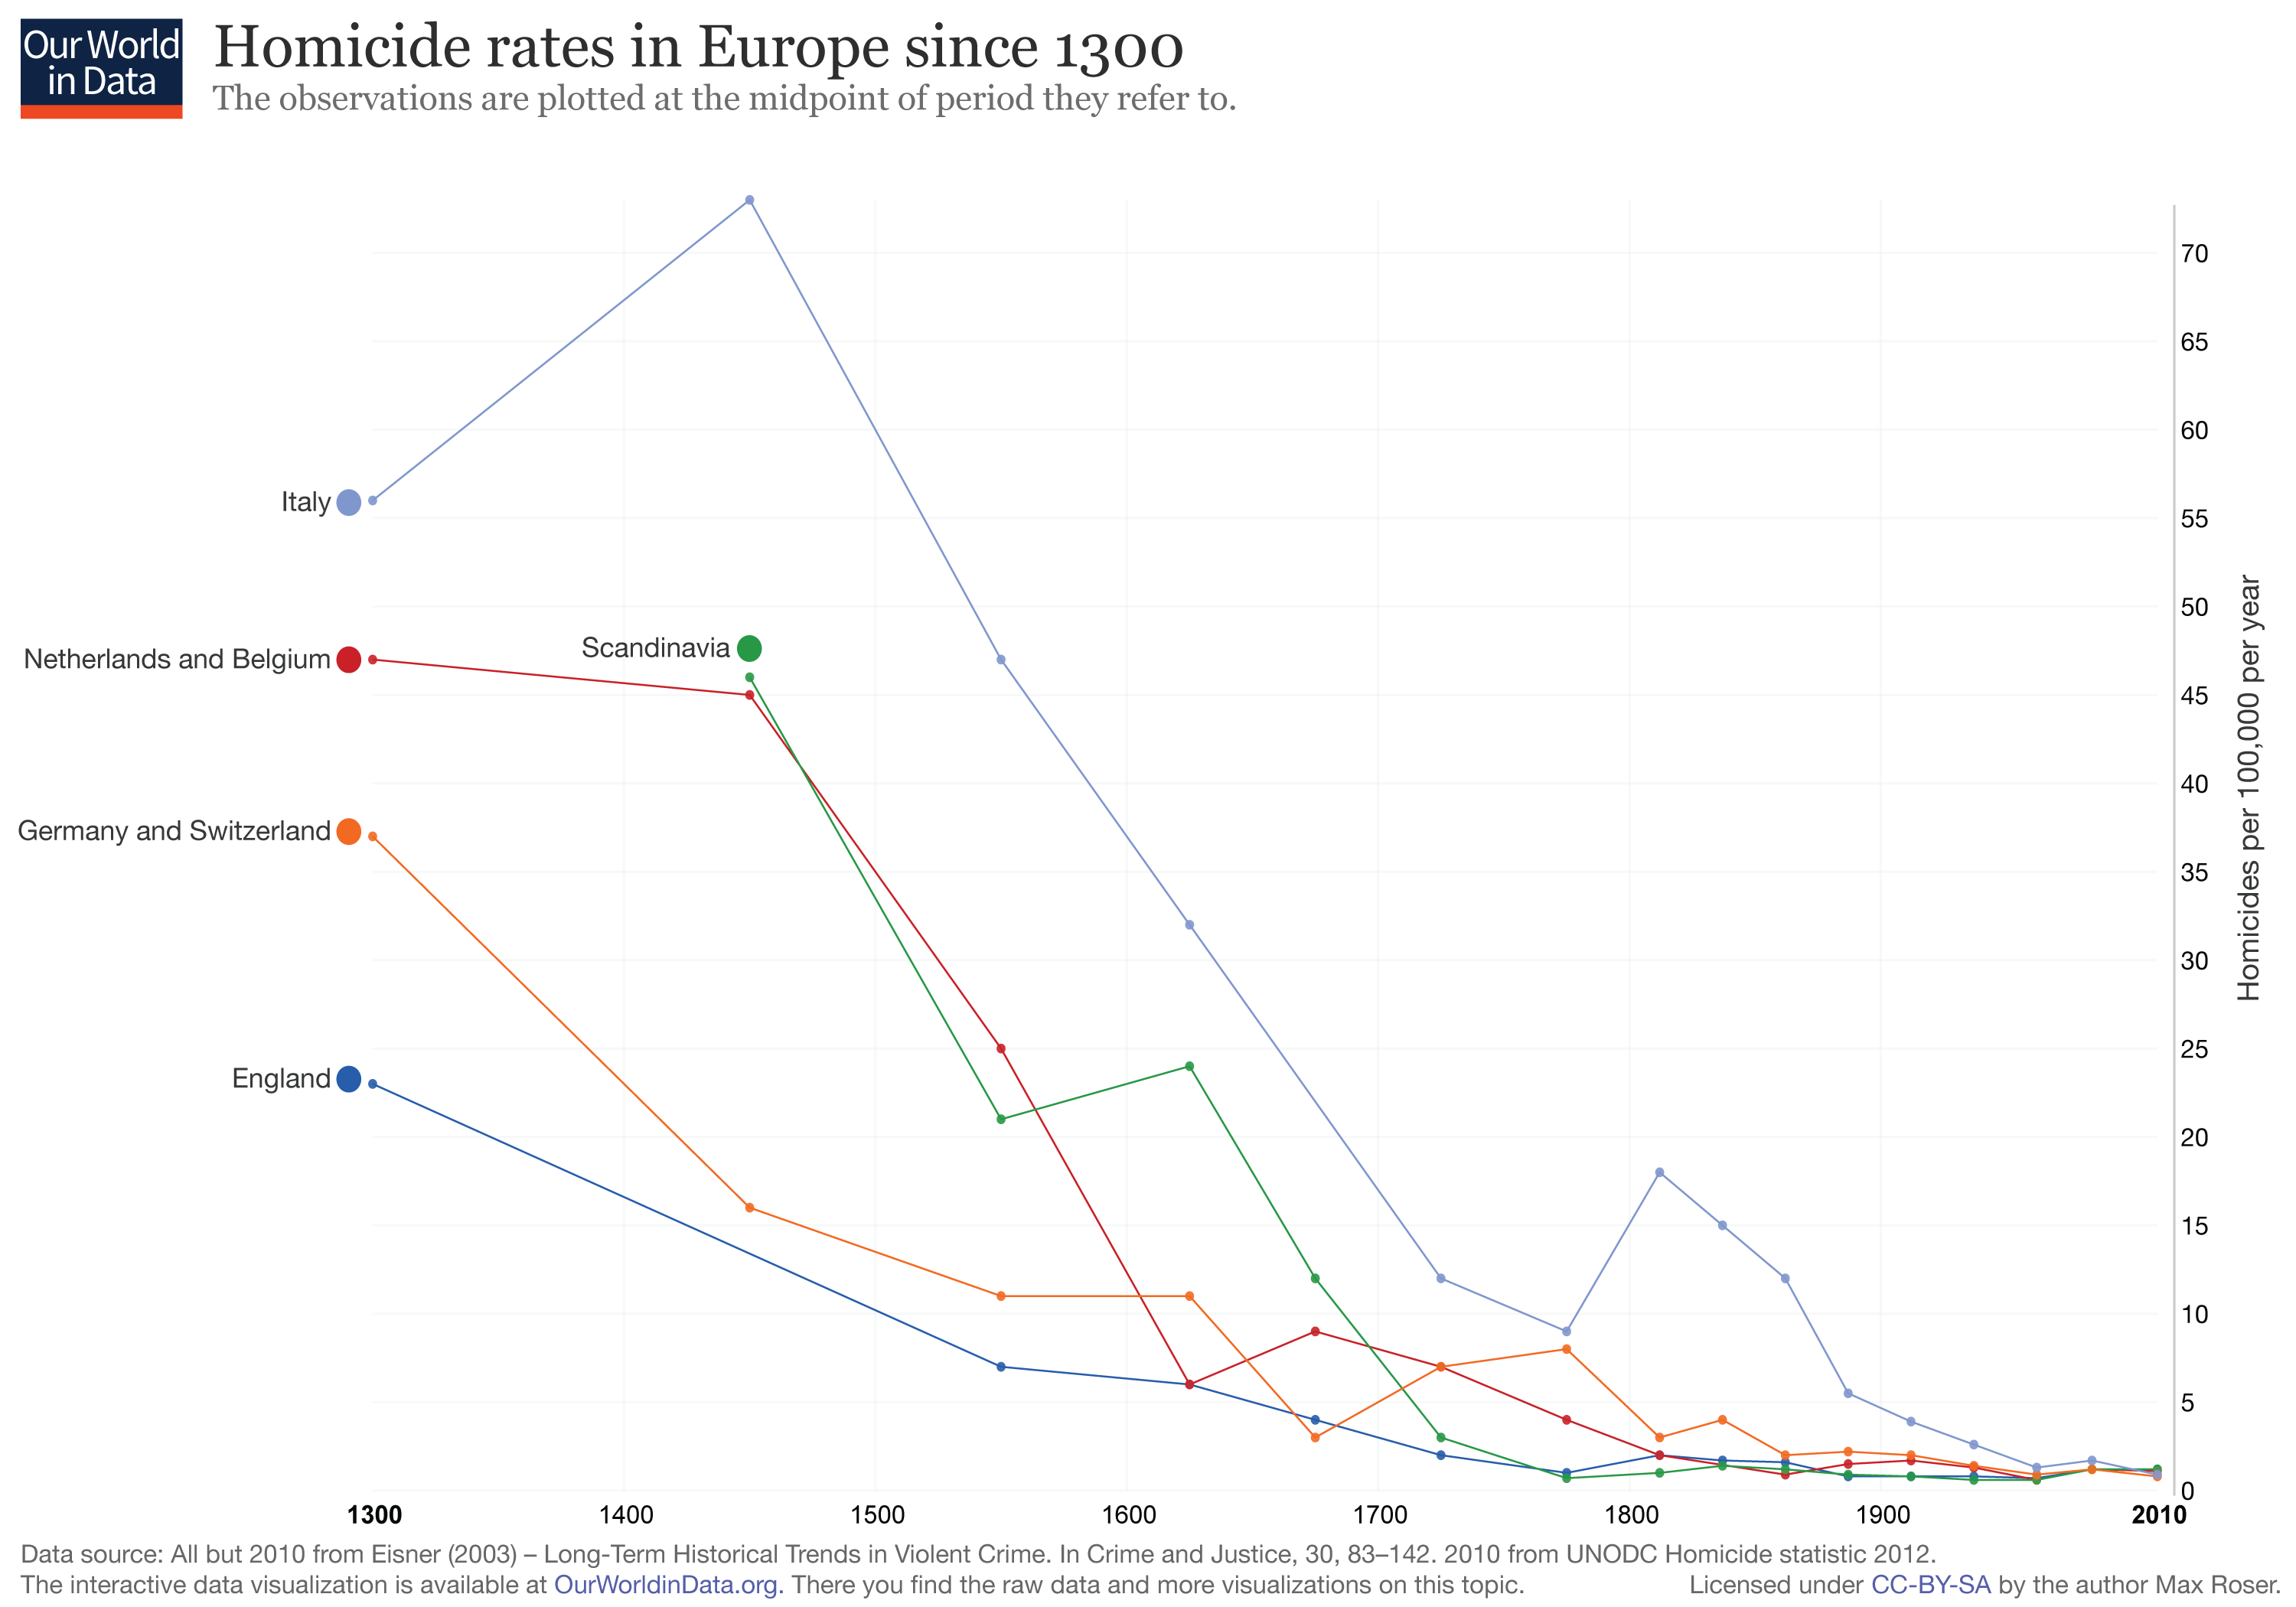
Source: Roser, Max (2016)45
Economic Inequality and Poverty:
| Pos. | Poverty (2020s) Lower is better %46 | Inequality in Life Expectancy (2019) Lower is better47 | Income Inequality (Gini Coefficient) (2023) Lower is better %48 | Multidimensional Poverty (2018) Lower is better Severity49 | |
|---|---|---|---|---|---|
| 1 | Albania | 0.34% | 7.20 | 29.4%50 | .003 |
| 2 | Armenia | 1.86% | 8.70 | 27.9%51 | .001 |
| 3 | Austria | 0.60% | 3.70 | 30.7%52 | |
| 4 | Azerbaijan | 13.90 | 26.6%53 | ||
| 5 | Belarus | 4.40 | 24.4%50 | ||
| 6 | Belgium | 0.06% | 3.60 | 26.6%52 | |
| 7 | Bosnia & Herzegovina | 5.40 | 33.0%54 | .008 | |
| 8 | Bulgaria | 1.00% | 6.10 | 39.0%52 | |
| 9 | Croatia | 0.36% | 4.30 | 28.9%52 | |
| 10 | Cyprus | 0.02% | 3.60 | 31.3%52 | |
| 11 | Czechia | 0.03% | 3.00 | 26.2%52 | |
| 12 | Denmark | 0.23% | 3.60 | 28.3%52 | |
| 13 | Estonia | 0.39% | 3.60 | 31.8%52 | |
| 14 | Finland | 0.09% | 3.00 | 27.7%52 | |
| 15 | France | 0.08% | 3.80 | 31.5%52 | |
| 16 | Georgia | 8.11% | 7.90 | 33.5%51 | |
| 17 | Germany | 0.24% | 3.80 | 32.4%50 | |
| 18 | Greece | 0.75% | 3.50 | 32.9%52 | |
| 19 | Hungary | 4.20 | 29.2%52 | ||
| 20 | Iceland | 2.40 | 26.1%55 | ||
| 21 | Ireland | 0.15% | 3.40 | 30.1%52 | |
| 22 | Italy | 0.84% | 3.10 | 34.8%52 | |
| 23 | Latvia | 0.47% | 5.40 | 34.3%52 | |
| 24 | Lithuania | 0.67% | 5.50 | 36.7%52 | |
| 25 | Luxembourg | 0.09% | 3.40 | 32.7%52 | |
| 26 | Macedonia | 7.90 | 33.5%56 | .010 | |
| 27 | Malta | 0.21% | 4.60 | 31.4%50 | |
| 28 | Moldova | 0.09% | 9.60 | 25.7%52 | .004 |
| 29 | Montenegro | 2.37% | 3.60 | 34.3%52 | .002 |
| 30 | Netherlands | 0.07% | 3.10 | 25.7%52 | |
| 31 | Norway | 0.24% | 3.00 | 27.7%56 | |
| 32 | Poland | 0.22% | 4.30 | 28.5%52 | |
| 33 | Portugal | 0.40% | 3.50 | 34.6%52 | |
| 34 | Romania | 1.65% | 6.30 | 33.9%52 | |
| 35 | Serbia | 1.92% | 4.90 | 33.1%52 | .001 |
| 36 | Slovakia | 0.45% | 5.00 | 24.1%52 | |
| 37 | Slovenia | 2.90 | 24.3%52 | ||
| 38 | Spain | 0.84% | 3.00 | 33.9%52 | |
| 39 | Sweden | 0.80% | 2.90 | 29.8%52 | |
| 40 | Switzerland | 0.11% | 3.50 | 33.7%50 | |
| 41 | Turkey | 0.87% | 9.00 | 44.4%52 | |
| 42 | Ukraine | 0.03% | 7.40 | 25.6%50 | .001 |
| 43 | UK | 0.50% | 4.10 | 32.4%52 | |
| 44 | Kosovo | 17.25% | 29.0%55 | ||
| Europe Avg | 1.20% | 4.86 | 30.7% | .004 | |
| World Avg | 11.40% | 14.59 | 36.5% | .154 | |
| q=44. No data: 1444 | |||||
6. Modernity and Learning
#education #english #intelligence #it_security #maths #metric #modernity #politics #religion #religiosity #research #science #secularisation #technology #the_internet
The most modern countries, with the best results from education, the highest levels of research, and with the easiest access to information on the Internet, are Finland, Iceland and Denmark57. The worst countries are S. Sudan, Eritrea and Somalia57. Despite improves in global education, access to tertiary (adult) education is becoming increasingly unequal between the rich haves and the poor have-nots58.
“Education, at all levels and ages, is the single most vital support for equality as well as being a country's most vital economic and social resource. [...] Every successful aspirant to modernisation and economic development, from Japan to South Korea, China to Chile, has got there with a big emphasis on education.”
Bill Emmott (2017)59
27 datasets are used to calculate points for each country, including multiple decades of data on Research and Development, Intellectual Endeavours, metric system adoption rate, Religiosity, IQ, Secondary Education, Length of Schooling, Maths, Science & Reading, the percent of citizens with access to the internet, Freedom On The Internet, IT Security, IPv6 Uptake and digital quality of life. The regions with the best average results per country are Scandinavia, Baltic States and Europe57, whereas the worst are Melanesia, Africa and Micronesia57.
For more, see:
- " Which Countries are Most Modern, With the Best Education and Internet Access?" by Vexen Crabtree (2025).
Modernity:
| Pos. | Research & Development (2016) Higher is better % RDP PPP | Intellectual Endeavours (2017) Lower is better Rank33 | Metric (2025) Higher is better %60 | Religiosity (2018) Lower is better %61 | IQ (2006) Higher is better62 | |
|---|---|---|---|---|---|---|
| 1 | Albania | 0.1563 | 105 | 95 | 15 | 90 |
| 2 | Andorra | 95 | 98 | |||
| 3 | Armenia | 0.2464 | 56 | 95 | 53 | 94 |
| 4 | Austria | 3.0065 | 6 | 100 | 12 | 100 |
| 5 | Azerbaijan | 0.2164 | 129 | 95 | 38 | 87 |
| 6 | Belarus | 0.6764 | 46 | 95 | 21 | 97 |
| 7 | Belgium | 2.4666 | 9 | 100 | 11 | 99 |
| 8 | Bosnia & Herzegovina | 0.3364 | 16 | 95 | 54 | |
| 9 | Bulgaria | 0.6564 | 14 | 95 | 19 | 93 |
| 10 | Croatia | 0.8164 | 33 | 95 | 42 | 90 |
| 11 | Cyprus | 0.4864 | 31 | 95 | ||
| 12 | Czechia | 2.0066 | 2 | 100 | 7 | 98 |
| 13 | Denmark | 3.0566 | 4 | 100 | 9 | 98 |
| 14 | Estonia | 1.4366 | 36 | 95 | 6 | 99 |
| 15 | Finland | 3.1766 | 7 | 100 | 10 | 99 |
| 16 | France | 2.2666 | 24 | 100 | 11 | 98 |
| 17 | Georgia | 0.1367 | 86 | 95 | 51 | 94 |
| 18 | Germany | 2.8466 | 21 | 100 | 10 | 99 |
| 19 | Greece | 0.8466 | 27 | 95 | 56 | 92 |
| 20 | Hungary | 1.3766 | 3 | 100 | 14 | 98 |
| 21 | Iceland | 1.8966 | 15 | 100 | 101 | |
| 22 | Ireland | 1.5266 | 32 | 95 | 22 | 92 |
| 23 | Italy | 1.2966 | 41 | 100 | 21 | 102 |
| 24 | Latvia | 0.6064 | 13 | 95 | 11 | 98 |
| 25 | Liechtenstein | 100 | ||||
| 26 | Lithuania | 0.9564 | 18 | 95 | 16 | 91 |
| 27 | Luxembourg | 1.2666 | 37 | 100 | ||
| 28 | Macedonia | 0.4464 | 19 | 95 | ||
| 29 | Malta | 0.8964 | 62 | 95 | ||
| 30 | Moldova | 0.3564 | 47 | 95 | 42 | 96 |
| 31 | Monaco | 100 | ||||
| 32 | Montenegro | 0.3864 | 48 | 95 | ||
| 33 | Netherlands | 1.9766 | 8 | 100 | 20 | 100 |
| 34 | Norway | 1.7066 | 49 | 100 | 19 | 100 |
| 35 | Poland | 0.9466 | 23 | 100 | 30 | 99 |
| 36 | Portugal | 1.2866 | 39 | 100 | 36 | 95 |
| 37 | Romania | 0.3866 | 30 | 100 | 50 | 94 |
| 38 | San Marino | 100 | ||||
| 39 | Serbia | 0.7364 | 28 | 95 | 34 | |
| 40 | Slovakia | 0.8966 | 42 | 100 | 23 | 96 |
| 41 | Slovenia | 2.3966 | 10 | 95 | 96 | |
| 42 | Spain | 1.2266 | 40 | 100 | 22 | 98 |
| 43 | Sweden | 3.1666 | 17 | 100 | 10 | 99 |
| 44 | Switzerland | 2.9668 | 11 | 100 | 9 | 101 |
| 45 | Turkey | 1.0166 | 55 | 95 | 68 | |
| 46 | Ukraine | 0.7664 | 1 | 95 | 23 | 97 |
| 47 | UK | 1.7066 | 5 | 90 | 10 | 100 |
| 48 | Vatican City | 100 | ||||
| 49 | Kosovo | 95 | 48 | |||
| Europe Avg | 1.32 | 31.3 | 97 | 25.8 | 96.6 | |
| World Avg | 0.84 | 82.0 | 92 | 54.3 | 85.6 | |
| q=49. No data: 938 | ||||||
Education:
| Pos. | Secondary Education (2018) Higher is better69 | Length of Schooling (2021) Higher is better Years70 | Maths, Science & Reading (2015) Higher is better Score71 | |
|---|---|---|---|---|
| 1 | Albania | 92.9% | 14.4 | 1245 |
| 2 | Andorra | 72.3% | 13.3 | |
| 3 | Armenia | 97.2% | 13.1 | |
| 4 | Austria | 100.0% | 16.0 | 1477 |
| 5 | Azerbaijan | 95.6% | 13.5 | |
| 6 | Belarus | 92.2% | 15.2 | |
| 7 | Belgium | 84.8% | 19.6 | 1508 |
| 8 | Bosnia & Herzegovina | 81.2% | 13.8 | |
| 9 | Bulgaria | 95.1% | 13.9 | 1319 |
| 10 | Croatia | 95.7% | 15.1 | 1426 |
| 11 | Cyprus | 80.3% | 15.6 | 1313 |
| 12 | Czechia | 99.8% | 16.2 | 1472 |
| 13 | Denmark | 89.3% | 18.7 | 1513 |
| 14 | Estonia | 100.0% | 15.9 | 1573 |
| 15 | Finland | 100.0% | 19.1 | 1568 |
| 16 | France | 83.5% | 15.8 | 1487 |
| 17 | Georgia | 98.0% | 15.6 | 1216 |
| 18 | Germany | 96.3% | 17.0 | 1524 |
| 19 | Greece | 64.8% | 20.0 | 1376 |
| 20 | Hungary | 97.2% | 15.0 | 1424 |
| 21 | Iceland | 100.0% | 19.2 | 1443 |
| 22 | Ireland | 88.3% | 18.9 | 1528 |
| 23 | Italy | 79.6% | 16.2 | 1456 |
| 24 | Latvia | 99.2% | 16.2 | 1460 |
| 25 | Liechtenstein | 15.2 | ||
| 26 | Lithuania | 94.9% | 16.3 | 1425 |
| 27 | Luxembourg | 100.0% | 14.4 | 1450 |
| 28 | Macedonia | 49.8% | 13.6 | 1107 |
| 29 | Malta | 78.2% | 16.8 | 1391 |
| 30 | Moldova | 96.4% | 14.4 | 1264 |
| 31 | Montenegro | 91.6% | 15.1 | 1256 |
| 32 | Netherlands | 88.3% | 18.7 | 1524 |
| 33 | Norway | 95.4% | 18.2 | 1513 |
| 34 | Poland | 85.3% | 16.0 | 1511 |
| 35 | Portugal | 54.2% | 16.9 | 1491 |
| 36 | Romania | 90.0% | 14.2 | 1313 |
| 37 | San Marino | 12.3 | ||
| 38 | Serbia | 89.5% | 14.4 | |
| 39 | Slovakia | 99.3% | 14.5 | 1389 |
| 40 | Slovenia | 97.6% | 17.7 | 1528 |
| 41 | Spain | 75.8% | 17.9 | 1475 |
| 42 | Sweden | 88.9% | 19.4 | 1487 |
| 43 | Switzerland | 96.5% | 16.5 | 1519 |
| 44 | Turkey | 53.1% | 18.3 | 1273 |
| 45 | Ukraine | 94.6% | 15.0 | |
| 46 | UK | 84.5% | 17.3 | 1499 |
| 47 | Kosovo | 1087 | ||
| Europe Avg | 88.3% | 16.1 | 1417 | |
| World Avg | 63.0% | 13.5 | 1389 | |
| q=47. No data: 1172 | ||||
Technology and Information:
| Pos. | Internet Users (2020s) Higher is better | Internet Freedom (2012) Lower is better73 | IT Security (2013) Lower is better74 | IPv6 Uptake (2017) Higher is better Ratio75 | Digital Quality of Life (2024) Higher is better76 | |
|---|---|---|---|---|---|---|
| 1 | Albania | 79% | 0.0 | 46.7% | ||
| 2 | Andorra | 94% | 0.0 | |||
| 3 | Armenia | 78% | 1.22 | 0.0 | 43.9% | |
| 4 | Austria | 93% | 7.5 | 70.8% | ||
| 5 | Azerbaijan | 87% | 50 | 1.21 | 0.0 | 46.0% |
| 6 | Belarus | 89% | 69 | 1.22 | 0.0 | 43.5% |
| 7 | Belgium | 94% | 55.4 | 66.1% | ||
| 8 | Bosnia & Herzegovina | 79% | 3.1 | 38.8% | ||
| 9 | Bulgaria | 77% | 1.3 | 66.3% | ||
| 10 | Croatia | 82% | 0.1 | 61.1% | ||
| 11 | Cyprus | 91% | 0.0 | 61.6% | ||
| 12 | Czechia | 84% | 0.24 | 10.1 | 63.2% | |
| 13 | Denmark | 98% | 3.1 | 72.3% | ||
| 14 | Estonia | 91% | 10 | 17.6 | 69.3% | |
| 15 | Finland | 93% | 14.1 | 76.9% | ||
| 16 | France | 86% | 1.13 | 18.8 | 73.9% | |
| 17 | Georgia | 77% | 30 | 0.0 | 43.4% | |
| 18 | Germany | 92% | 15 | 1.46 | 41.8 | 77.9% |
| 19 | Greece | 82% | 33.5 | 58.9% | ||
| 20 | Hungary | 90% | 19 | 0.27 | 7.4 | 60.2% |
| 21 | Iceland | 99% | 0.3 | |||
| 22 | Ireland | 95% | 0.11 | 26.1 | 65.9% | |
| 23 | Italy | 81% | 23 | 1.15 | 1.7 | 63.3% |
| 24 | Latvia | 91% | 0.33 | 2.2 | 63.2% | |
| 25 | Liechtenstein | 96% | 0.0 | |||
| 26 | Lithuania | 87% | 0.1 | 67.8% | ||
| 27 | Luxembourg | 99% | 0.11 | 32.4 | 70.0% | |
| 28 | Macedonia | 84% | 0.0 | 45.7% | ||
| 29 | Malta | 89% | 0.0 | 61.0% | ||
| 30 | Moldova | 72% | 0.71 | 0.3 | 45.5% | |
| 31 | Monaco | 99% | 0.0 | |||
| 32 | Montenegro | 85% | 0.0 | 44.9% | ||
| 33 | Netherlands | 93% | 1.47 | 10.5 | 72.6% | |
| 34 | Norway | 98% | 14.7 | 64.5% | ||
| 35 | Poland | 86% | 0.55 | 3.6 | 66.0% | |
| 36 | Portugal | 84% | 26.6 | 62.8% | ||
| 37 | Romania | 86% | 0.52 | 8.7 | 67.8% | |
| 38 | San Marino | 83% | 0.0 | |||
| 39 | Serbia | 83% | 0.1 | 53.5% | ||
| 40 | Slovakia | 89% | 0.8 | 60.7% | ||
| 41 | Slovenia | 89% | 5.4 | 62.3% | ||
| 42 | Spain | 95% | 0.88 | 0.6 | 70.5% | |
| 43 | Sweden | 95% | 0.44 | 3.8 | 68.7% | |
| 44 | Switzerland | 96% | 0.55 | 35.1 | 69.0% | |
| 45 | Turkey | 83% | 46 | 0.52 | 0.3 | 52.2% |
| 46 | Ukraine | 80% | 27 | 1.44 | 0.1 | 54.4% |
| 47 | UK | 96% | 25 | 1.34 | 24.7 | 69.3% |
| 48 | Guernsey | 0.0 | ||||
| 49 | Isle of Man | 0.0 | ||||
| 50 | Jersey | 0.1 | ||||
| 51 | Faroe Islands | 1.4 | ||||
| Europe Avg | 88.3% | 31.4 | 0.80 | 8.11 | 61.0% | |
| World Avg | 67.8% | 46.7 | 0.98 | 3.82 | 48.4% | |
| q=51. No data: 777 | ||||||
7. Health
#2010s #alcohol #birth_control #children's_health #demographics #health #life_expectancy #longevity #mental_health #obesity #overpopulation #parenting #population #smoking #suicide #vaccines
The countries with the best overall approach to public health, in terms of both public policy and individual lifestyle choices, are Monaco, Liechtenstein and Japan78. These countries are worth emulating. And, although often through no fault of the average citizen, the worst countries are Angola, Somalia and S. Sudan78.
42 datasets are used to calculate points for each country, including multiple decades of data on its average life expectancy, its alcohol consumption rate, its fertility rate, its smoking rate, its suicide rate, its food aid and health contributions and WHO compliance, the prevalence of overweight adults, obesity rate, its adolescent birth rate, delivery rate of infant DTP immunizations, delivery rate of 7x Infant Immunizations 2011-2015 and childhood mortality. The regions with the best average results per country are Scandinavia, Europe and The Mediterranean78, whereas the worst are Micronesia, Africa and Melanesia78.
For more, see:
Health:
| Pos. | Life Expectancy (2021) Higher is better Years6 | Alcohol Consumption (2016) Lower is better Per Capita79 | Fertility Rate (2022) 2.0 is best14 | Smoking in the 2020s Lower is better %80 | Suicide Rate in the 2010s Lower is better Per 100k81 | Food Aid, Health Contributions & WHO Compliance (2017) Lower is better Rank33 | Overweight Adults (1976) Lower is better %82 | Adult Obesity (2022) Lower is better %83 | |
|---|---|---|---|---|---|---|---|---|---|
| 1 | Albania | 76.5 | 7.5 | 1.38 | 22.0% | 4.66 | 138 | 33.8 | 26.6% |
| 2 | Andorra | 80.4 | 11.3 | 36.2% | 47.0 | 20.5% | |||
| 3 | Armenia | 72.0 | 5.5 | 1.58 | 25.0% | 5.44 | 31 | 34.6 | 27.9% |
| 4 | Austria | 81.6 | 11.6 | 1.41 | 24.9% | 15.88 | 28 | 35.1 | 17.0% |
| 5 | Azerbaijan | 69.4 | 0.8 | 1.67 | 19.6% | 2.18 | 89 | 32.2 | 27.5% |
| 6 | Belarus | 72.4 | 11.2 | 1.50 | 30.2% | 24.43 | 67 | 38.2 | 26.6% |
| 7 | Belgium | 81.9 | 12.1 | 1.53 | 26.8% | 19.45 | 16 | 43.9 | 22.0% |
| 8 | Bosnia & Herzegovina | 75.3 | 6.4 | 1.35 | 36.2% | 10.51 | 95 | 32.6 | 25.5% |
| 9 | Bulgaria | 71.8 | 12.7 | 1.78 | 39.5% | 10.61 | 53 | 41.4 | 24.2% |
| 10 | Croatia | 77.6 | 8.9 | 1.53 | 37.0% | 16.67 | 83 | 38.2 | 35.7% |
| 11 | Cyprus | 81.2 | 10.8 | 1.31 | 35.6% | 5.16 | 59 | 33.0 | 25.1% |
| 12 | Czechia | 77.7 | 14.4 | 1.62 | 30.0% | 14.46 | 47 | 47.1 | 31.3% |
| 13 | Denmark | 81.4 | 10.4 | 1.55 | 16.2% | 11.66 | 3 | 36.7 | 14.3% |
| 14 | Estonia | 77.1 | 11.6 | 1.41 | 28.3% | 17.28 | 27 | 43.9 | 26.7% |
| 15 | Finland | 82.0 | 10.7 | 1.32 | 22.3% | 16.11 | 12 | 35.7 | 23.7% |
| 16 | France | 82.5 | 12.6 | 1.79 | 34.6% | 16.13 | 23 | 40.4 | 10.9% |
| 17 | Georgia | 71.7 | 9.8 | 2.06 | 31.8% | 4.69 | 66 | 31.4 | 38.9% |
| 18 | Germany | 80.6 | 13.4 | 1.46 | 21.3% | 13.03 | 7 | 38.7 | 24.2% |
| 19 | Greece | 80.1 | 10.4 | 1.43 | 32.7% | 4.76 | 29 | 41.2 | 33.7% |
| 20 | Hungary | 74.5 | 11.4 | 1.52 | 32.2% | 20.94 | 33 | 44.0 | 36.4% |
| 21 | Iceland | 82.7 | 9.1 | 1.59 | 9.3% | 12.55 | 41 | 40.6 | 22.6% |
| 22 | Ireland | 82.0 | 13.0 | 1.70 | 19.3% | 10.41 | 2 | 34.5 | 30.8% |
| 23 | Italy | 82.9 | 7.5 | 1.24 | 22.5% | 7.17 | 24 | 40.0 | 21.6% |
| 24 | Latvia | 73.6 | 12.9 | 1.47 | 33.9% | 20.98 | 70 | 44.1 | 29.8% |
| 25 | Liechtenstein | 83.3 | 1.47 | ||||||
| 26 | Lithuania | 73.7 | 15.0 | 1.27 | 31.4% | 33.72 | 64 | 42.6 | 31.1% |
| 27 | Luxembourg | 82.6 | 13.0 | 1.31 | 23.0% | 11.27 | 11 | 37.9 | 20.2% |
| 28 | Macedonia | 73.8 | 8.1 | 1.60 | 6.10 | 34 | 39.2 | 30.6% | |
| 29 | Malta | 83.8 | 8.1 | 1.15 | 24.8% | 6.42 | 76 | 49.6 | 34.6% |
| 30 | Moldova | 68.8 | 15.2 | 1.80 | 29.7% | 15.53 | 87 | 33.4 | 25.6% |
| 31 | Monaco | 85.9 | |||||||
| 32 | Montenegro | 76.3 | 8.0 | 1.80 | 32.1% | 13.48 | 134 | 32.1 | 21.1% |
| 33 | Netherlands | 81.7 | 8.7 | 1.49 | 21.3% | 11.19 | 9 | 33.7 | 16.9% |
| 34 | Norway | 83.2 | 7.5 | 1.41 | 14.3% | 12.03 | 5 | 36.5 | 19.8% |
| 35 | Poland | 76.5 | 11.6 | 1.26 | 23.6% | 16.13 | 79 | 40.8 | 31.4% |
| 36 | Portugal | 81.0 | 12.3 | 1.43 | 25.7% | 12.74 | 39 | 31.5 | 27.1% |
| 37 | Romania | 74.2 | 12.7 | 1.81 | 30.1% | 11.27 | 112 | 36.5 | 38.2% |
| 38 | San Marino | 80.9 | |||||||
| 39 | Serbia | 74.2 | 11.1 | 1.63 | 39.6% | 17.52 | 106 | 36.5 | 26.1% |
| 40 | Slovakia | 74.9 | 11.5 | 1.57 | 32.5% | 11.30 | 52 | 37.0 | 30.3% |
| 41 | Slovenia | 80.7 | 12.6 | 1.55 | 20.2% | 20.27 | 57 | 36.1 | 22.2% |
| 42 | Spain | 83.0 | 10.0 | 1.16 | 28.5% | 7.88 | 22 | 41.6 | 19.2% |
| 43 | Sweden | 83.0 | 9.2 | 1.52 | 22.7% | 14.71 | 1 | 38.1 | 16.4% |
| 44 | Switzerland | 84.0 | 11.5 | 1.39 | 25.6% | 14.61 | 6 | 31.1 | 13.7% |
| 45 | Turkey | 76.0 | 2.0 | 1.88 | 30.5% | 3.26 | 44 | 35.2 | 34.3% |
| 46 | Ukraine | 71.6 | 8.6 | 1.27 | 25.0% | 23.49 | 55 | 42.2 | 29.2% |
| 47 | UK | 80.7 | 11.5 | 1.57 | 14.3% | 8.51 | 4 | 40.6 | 28.7% |
| 48 | Isle of Man | 1.57 | |||||||
| 49 | Gibraltar | 1.84 | |||||||
| 50 | Faroe Islands | 2.05 | |||||||
| 51 | Kosovo | 1.51 | |||||||
| 52 | Channel Islands | 1.47 | |||||||
| Europe Avg | 78.36 | 10.3 | 1.53 | 27.0% | 12.94 | 47.4 | 38.2 | 25.9% | |
| World Avg | 71.28 | 6.2 | 2.47 | 20.0% | 9.24 | 82.0 | 27.1 | 24.7% | |
| q=52. No data: 616 | |||||||||
Children's Health:
| Pos. | Adolescent Birth Rate (2022) Lower is better Per 100084 | Infant DTP Immunizations (2020s) Higher is better Avg %85 | 7x Infant Immunizations (2011-2015) (2015) Higher is better Avg %86 | Infant Mortality (2020s) Lower is better Per 100087 | |
|---|---|---|---|---|---|
| 1 | Albania | 14.5 | 97.9 | 97.1 | 10.41 |
| 2 | Andorra | 5.9 | 98.4 | 97.1 | 3.69 |
| 3 | Armenia | 18.3 | 94.6 | 95.6 | 15.18 |
| 4 | Austria | 5.2 | 89.9 | 93.8 | 3.81 |
| 5 | Azerbaijan | 40.1 | 58.0 | 92.2 | 29.20 |
| 6 | Belarus | 11.2 | 97.8 | 85.3 | 4.27 |
| 7 | Belgium | 5.1 | 97.9 | 97.8 | 4.17 |
| 8 | Bosnia & Herzegovina | 9.4 | 81.4 | 88.0 | 6.75 |
| 9 | Bulgaria | 38.2 | 92.8 | 93.7 | 8.60 |
| 10 | Croatia | 8.2 | 95.3 | 95.9 | 5.02 |
| 11 | Cyprus | 6.8 | 96.7 | 95.3 | 3.03 |
| 12 | Czechia | 9.4 | 95.1 | 98.7 | 3.18 |
| 13 | Denmark | 1.8 | 97.2 | 92.3 | 4.03 |
| 14 | Estonia | 8.1 | 87.1 | 93.9 | 3.39 |
| 15 | Finland | 4.1 | 93.8 | 98.1 | 2.59 |
| 16 | France | 9.4 | 97.5 | 92.6 | 4.17 |
| 17 | Georgia | 29.7 | 91.0 | 93.1 | 11.17 |
| 18 | Germany | 7.2 | 93.7 | 94.0 | 3.94 |
| 19 | Greece | 8.3 | 98.0 | 97.3 | 4.14 |
| 20 | Hungary | 21.9 | 99.0 | 99.0 | 5.12 |
| 21 | Iceland | 5.1 | 94.4 | 91.5 | 2.64 |
| 22 | Ireland | 5.9 | 93.3 | 89.2 | 3.76 |
| 23 | Italy | 3.9 | 94.4 | 93.8 | 3.55 |
| 24 | Latvia | 10.5 | 97.3 | 92.8 | 5.56 |
| 25 | Liechtenstein | 3.0 | |||
| 26 | Lithuania | 9.7 | 91.6 | 93.9 | 4.97 |
| 27 | Luxembourg | 4.2 | 99.0 | 98.0 | 2.60 |
| 28 | Macedonia | 16.1 | 88.3 | 95.2 | 9.95 |
| 29 | Malta | 11.5 | 98.5 | 95.5 | 6.58 |
| 30 | Moldova | 27.2 | 87.0 | 91.5 | 15.77 |
| 31 | Monaco | 6.9 | 99.0 | 97.3 | 3.55 |
| 32 | Montenegro | 9.7 | 87.5 | 89.9 | 4.53 |
| 33 | Netherlands | 2.7 | 93.0 | 88.1 | 4.14 |
| 34 | Norway | 2.2 | 97.6 | 94.3 | 2.78 |
| 35 | Poland | 9.2 | 96.6 | 96.5 | 5.05 |
| 36 | Portugal | 7.1 | 99.0 | 95.7 | 3.62 |
| 37 | Romania | 35.4 | 84.7 | 92.7 | 9.55 |
| 38 | San Marino | 3.7 | 90.7 | 79.3 | 2.11 |
| 39 | Serbia | 14.4 | 92.6 | 93.5 | 6.52 |
| 40 | Slovakia | 26.6 | 96.7 | 97.0 | 6.31 |
| 41 | Slovenia | 4.4 | 90.4 | 95.2 | 2.72 |
| 42 | Spain | 6.3 | 95.6 | 96.5 | 3.42 |
| 43 | Sweden | 3.3 | 96.5 | 77.8 | 2.87 |
| 44 | Switzerland | 2.2 | 96.6 | 95.3 | 4.29 |
| 45 | Turkey | 15.7 | 98.0 | 95.5 | 13.98 |
| 46 | Ukraine | 15.2 | 85.3 | 55.2 | 9.82 |
| 47 | UK | 10.0 | 92.4 | 94.6 | 4.62 |
| 48 | Kosovo | 90.9 | 15.11 | ||
| Europe Avg | 11.4 | 93.2 | 92.7 | 6.30 | |
| World Avg | 43.8 | 88.5 | 88.3 | 32.19 | |
| q=48. No data: 1088 | |||||
8. Human Rights, Equality & Tolerance
#christianity #equality #Europe #freedom #gender_equality #human_rights #LGBT_rights #morals #poland #politics #prejudice #tolerance #turkey
| Human Rights, Equality & Tolerance (2025)13 | |||
|---|---|---|---|
| Pos. | Lower is better Avg Rank13 | ||
| 1 | Sweden | 7.5 | |
| 2 | Netherlands | 8.6 | |
| 3 | Denmark | 9.0 | |
| 4 | Norway | 9.1 | |
| 5 | Iceland | 15.3 | |
| 6 | Finland | 17.7 | |
| 7 | Luxembourg | 18.1 | |
| 8 | Belgium | 18.7 | |
| 9 | France | 23.5 | |
| 10 | Austria | 24.3 | |
| ... | |||
| 47 | Vatican City | 113.6 | |
| 48 | Belarus | 121.5 | |
| 49 | Azerbaijan | 123.0 | |
| Europe Avg | 52.39 | ||
| World Avg | 90.04 | ||
| q=49. | |||
The best countries in Europe at protecting human rights, engendering tolerance and supporting equality, are Sweden, Netherlands and Denmark and the continent as a whole does better than the global average. The worst countries are Azerbaijan, Belarus and Vatican City. Europe has an excellent record on women's rights and gender equality. Prejudice against any protected characteristics found in HR law is actively challenged in most of Europe, especially in countries that have signed up for the European Council of Human Rights (part of the Council of Europe), which frequently sees cases brought by citizens against member states. LGBT rights, freedom of religion and freedom of thought are all routine. The most powerful and effective agents working against human rights in Europe are Christian institutions, especially the Catholic church and conservative movements, plus, the occasional push by backwards political parties or individual leaders. Some of these factors create long-term problems, such as in Poland or Turkey. But, there is nowhere else in the world have the spurious prejudices of human culture have been so diminished as in Europe.
For full commentary and data, see:
9. Religion and Beliefs
#belief #buddhism #christianity #folk_religion #god #hinduism #human_development #islam #judaism #no_religion #religion #religiosity #secularisation
Over the last 60 years, religion in Europe has seen a strong decline. On average throughout the 27 EU countries, only half of its people believe in God89 and 25.4% directly say that they have no religion90. There is much variation from country to country. Only 16% of the populace of Estonia believe in God and the Scandinavian countries are highly atheist. But 95% believe in Malta. Two main social groups are particularly prone to belief in God; those over 55 years old and those whose education did not proceed beyond the 15-year-old stage.89. For a discussion on secularisation in general, see: "Secularisation Theory: Will Modern Society Reject Religion? What is Secularism?" by Vexen Crabtree
Despite the low rate of belief in God, many Europeans still claim to belong to theistic religions. 49.5% of the population of Europe say they are Catholic Christian, 15.7% say they're Muslim, 12.7% say they're Protestant Christian, 8.6% say they're Orthodox Christian and 0.4% say they are Jewish90. These numbers mean that at least 30% of Europeans are putting down a religion despite not believing in the very basic first principal of the religion they put down. In some places, this percent is higher. In France only 52% of Catholic believe in God and "only 18 percent define God according to the teachings of the Catholic Church"91. This is all because most people in Europe confuse religion and cultural heritage, and for many the actual beliefs of a religion don't really matter. For a discussion of this, see: "Institutionalized Religions Have Their Numbers Inflated by National Polls" by Vexen Crabtree.
| Pos. | Religiosity (2018) Lower is better %61 | Disbelief In God (2007) Higher is better %92 | Jews (2010) %93 | Christians (2010) %93 | Muslims (2010) %93 | Hindus (2010) %93 | Buddhists (2010) %93 | Folk Religion (2010) %93 | Unaffiliated (2010) %93 | |
|---|---|---|---|---|---|---|---|---|---|---|
| 1 | Albania | 15 | 8 | 0.0 | 17.8 | 74.5 | 0.0 | 0.0 | 0.0 | 7.7 |
| 2 | Armenia | 53 | 14 | 0.0 | 97.3 | 0.3 | 0.0 | 0.0 | 1.2 | 1.2 |
| 3 | Austria | 12 | 18 | 0.1 | 68.2 | 8.3 | 0.1 | 0.3 | 0.6 | 22.4 |
| 4 | Azerbaijan | 38 | 0 | 0.1 | 0.4 | 94.7 | 0.0 | 0.0 | 0.0 | 4.8 |
| 5 | Belarus | 21 | 17 | 0.1 | 85.1 | 0.3 | 0.0 | 0.0 | 0.7 | 13.8 |
| 6 | Belgium | 11 | 43 | 0.3 | 51.0 | 6.8 | 0.2 | 0.2 | 2.6 | 39.0 |
| 7 | Bosnia & Herzegovina | 54 | 0.0 | 44.7 | 53.6 | 0.0 | 0.0 | 0.6 | 1.0 | |
| 8 | Bulgaria | 19 | 34 | 0.0 | 79.5 | 10.3 | 0.0 | 0.0 | 0.1 | 10.0 |
| 9 | Croatia | 42 | 7 | 0.0 | 90.9 | 1.4 | 0.0 | 0.0 | 1.1 | 6.7 |
| 10 | Cyprus | 0.0 | 67.7 | 24.4 | 0.3 | 0.6 | 0.5 | 6.6 | ||
| 11 | Czechia | 7 | 61 | 0.0 | 26.4 | 0.3 | 0.0 | 0.1 | 0.3 | 72.8 |
| 12 | Denmark | 9 | 48 | 0.1 | 76.9 | 4.2 | 0.4 | 0.7 | 1.0 | 16.6 |
| 13 | Estonia | 6 | 49 | 0.1 | 52.6 | 0.6 | 0.1 | 0.2 | 2.8 | 43.6 |
| 14 | Finland | 10 | 28 | 0.1 | 72.3 | 1.6 | 0.1 | 0.3 | 0.5 | 25.0 |
| 15 | France | 11 | 44 | 0.7 | 46.5 | 9.1 | 0.1 | 0.7 | 0.3 | 42.6 |
| 16 | Georgia | 51 | 4 | 0.0 | 88.2 | 10.5 | 0.0 | 0.0 | 0.3 | 1.0 |
| 17 | Germany | 10 | 42 | 0.1 | 56.2 | 6.5 | 0.2 | 0.3 | 0.4 | 36.1 |
| 18 | Greece | 56 | 16 | 0.0 | 89.5 | 5.1 | 0.1 | 0.0 | 0.5 | 4.7 |
| 19 | Hungary | 14 | 32 | 0.1 | 72.4 | 0.1 | 0.1 | 0.2 | 0.1 | 27.0 |
| 20 | Iceland | 16 | 0.2 | 74.9 | 1.2 | 0.2 | 1.3 | 2.4 | 19.8 | |
| 21 | Ireland | 22 | 5 | 0.1 | 81.2 | 1.7 | 0.7 | 0.2 | 0.5 | 15.6 |
| 22 | Italy | 21 | 6 | 0.1 | 80.5 | 4.4 | 0.4 | 0.6 | 0.7 | 13.3 |
| 23 | Latvia | 11 | 20 | 0.2 | 77.3 | 0.7 | 0.0 | 0.1 | 4.7 | 17.0 |
| 24 | Lithuania | 16 | 13 | 0.0 | 92.2 | 0.1 | 0.0 | 0.0 | 0.6 | 7.1 |
| 25 | Luxembourg | 0.5 | 65.9 | 1.8 | 0.4 | 0.5 | 5.7 | 25.3 | ||
| 26 | Macedonia | 0.0 | 64.7 | 34.7 | 0.0 | 0.0 | 0.1 | 0.5 | ||
| 27 | Malta | 0.3 | 88.6 | 3.6 | 1.4 | 0.6 | 0.2 | 5.2 | ||
| 28 | Moldova | 42 | 6 | 0.0 | 99.5 | 0.2 | 0.0 | 0.0 | 0.0 | 0.2 |
| 29 | Montenegro | 0.0 | 76.0 | 21.3 | 0.0 | 0.0 | 1.5 | 1.1 | ||
| 30 | Netherlands | 20 | 42 | 0.2 | 35.1 | 5.5 | 0.6 | 0.3 | 4.2 | 54.1 |
| 31 | Norway | 19 | 31 | 0.1 | 71.4 | 4.1 | 0.2 | 0.7 | 1.0 | 22.5 |
| 32 | Poland | 30 | 3 | 0.0 | 91.2 | 0.0 | 0.0 | 0.0 | 0.1 | 8.6 |
| 33 | Portugal | 36 | 4 | 0.0 | 85.1 | 0.4 | 0.2 | 0.2 | 0.3 | 13.8 |
| 34 | Romania | 50 | 4 | 0.0 | 98.5 | 0.4 | 0.0 | 0.0 | 0.1 | 0.9 |
| 35 | Serbia | 34 | 0.0 | 91.5 | 4.4 | 0.0 | 0.0 | 0.0 | 4.0 | |
| 36 | Slovakia | 23 | 17 | 0.0 | 73.7 | 0.1 | 0.0 | 0.1 | 0.7 | 25.3 |
| 37 | Slovenia | 35 | 0.0 | 65.4 | 1.6 | 0.0 | 0.0 | 0.6 | 32.3 | |
| 38 | Spain | 22 | 15 | 0.0 | 69.5 | 3.6 | 0.1 | 0.0 | 0.4 | 26.4 |
| 39 | Sweden | 10 | 64 | 0.2 | 60.8 | 8.1 | 0.5 | 0.8 | 0.8 | 28.9 |
| 40 | Switzerland | 9 | 17 | 0.2 | 61.6 | 6.1 | 0.5 | 0.6 | 0.2 | 30.8 |
| 41 | Turkey | 68 | 0.0 | 0.1 | 97.1 | 0.0 | 0.1 | 0.1 | 2.5 | |
| 42 | Ukraine | 23 | 20 | 0.1 | 83.4 | 0.6 | 0.0 | 0.3 | 0.4 | 15.1 |
| 43 | UK | 10 | 42 | 0.4 | 49.4 | 6.4 | 1.7 | 0.5 | 1.4 | 40.2 |
| 44 | Kosovo | 48 | 0.0 | 5.6 | 94.3 | 0.0 | 0.0 | 0.0 | 0.1 | |
| 45 | Channel Islands | 0.1 | 85.2 | 0.1 | 0.1 | 0.0 | 0.3 | 14.2 | ||
| Europe Avg | 25.8 | 23.6 | 0.1 | 66.9 | 13.7 | 0.2 | 0.2 | 0.9 | 17.9 | |
| World Avg | 54.3 | 9.9 | 0.4 | 53.5 | 26.5 | 2.3 | 3.8 | 2.5 | 10.8 | |
| q=45. No data: 1394 | ||||||||||
Links:
- Compare to other regions of the world
- A List of All Religions and Belief Systems
- Institutionalized Religions Have Their Numbers Inflated by National Polls
- Secularisation Theory: Will Modern Society Reject Religion? What is Secularism?
- Human Religions
- Country by Country Comparison
- Religion and Belief in God in Europe as a Whole
- European Law and Values on Religion
- The Banning of Face Coverings such as the Niqab and Burqa in Europe
- Case Studies
10. The European Union (EU)95
- European Democratic and Social Values, and Fundamental Rights
- The State of the EU Constitution
- Structure, Staffing, Brussels and Strasbourg
- Forms of European Unity
- The Benefits of the European Union
- Supporting Human Rights
- The EU is in Crises
- EU Immigration and Internal Migration
- The Benefits of the Future
- About Europe