China and the Environment
https://www.humantruth.info/china_environment.html
By Vexen Crabtree 2026
#biodiversity #china #china_and_the_environment #deforestation #environmentalism #internationalism #japan #over-exploitation #pakistan #pollution #the_environment #USA
| China People's Republic of China [Country Profile Page] |  |
|---|---|
| Status | Independent State |
| Social and Moral Index | 68th best |
| Location | Asia |
| Population | 1.4b1 |
| Life Expectancy | 78.21yrs (2017)2 |
China is the 3rd-richest country for plant species diversity3. China ranks 73rd in the world in terms of its responsibility towards the environment. This is calculated from 21 data sets. China comes in the best 20 in its forested percent change 2000-20204. It does better than average in its score on the Green Future Index5 (one of the highest in Asia) and in its sign-up rate to major international accords on protecting the environment. Although in 1983 "environmental protection was declared a basic national principle" in reality, economic development often takes priority and "many environmental protection laws and policies [are] not effectively implemented or enforced"6. Nonetheless by 2005 it had made "a big effort to protect its outstanding biodiversity with 1,757 nature reserves covering 13% of its land plus numerous zoos, wildlife centres and gene banks"6. It has some unique environmentally-wise cultural practices, such as raising fish in irrigated rice fields, simultaneously producing fertiliser and controlling pests6. It has gained positive commendations for its epic effort to artificially bring parts of its ancient Taklamakan Desert to productive life, which is successful enough that its absorption of CO2 is detectable from space7.
But, things could still be better. China does worse than average in terms of reducing annual meat consumption per person8, reducing annual meat consumption per person8, its environmental performance9 and in energy to GDP efficiency10. And finally, it falls into the worst-performing 20 in the rate of rational beliefs on the environment in the population11 (amongst the lowest in Asia).China's list of worsening environmental problems is formidable: biodiversity loss, disappearing wetlands, grassland degradation, overgrazing, soil erosion and desertification, trash accumulation, river flow cessation, salinization, water pollution and water shortages3, and some of its cities have the worst air pollution in the world12.
1. China's Responsibility Towards The Environment
#climate_change #the_environment
| Compared to Asia (2025)13 | ||
|---|---|---|
| Pos. | Lower is better Avg Rank13 | |
| 1 | Sri Lanka | 34.9 |
| 2 | Nepal | 47.9 |
| 3 | India | 49.5 |
| ... | ||
| 14 | Yemen | 71.9 |
| 15 | Pakistan | 72.0 |
| 16 | Turkey | 75.0 |
| 17 | China | 75.2 |
| 18 | Afghanistan | 75.7 |
| 19 | Syria | 77.4 |
| 20 | Iran | 79.0 |
| 21 | UAE | 81.8 |
| 22 | Singapore | 83.3 |
| Asia Avg | 88.09 | |
| q=51. | ||
| Responsibility Towards The Environment (2025)13 | ||
|---|---|---|
| Pos. | Lower is better Avg Rank13 | |
| 1 | Sri Lanka | 34.9 |
| 2 | Uruguay | 43.2 |
| 3 | Switzerland | 45.0 |
| ... | ||
| 70 | Chad | 74.4 |
| 71 | UK | 74.4 |
| 72 | Turkey | 75.0 |
| 73 | China | 75.2 |
| 74 | Belgium | 75.3 |
| 75 | Cape Verde | 75.6 |
| 76 | Afghanistan | 75.7 |
| 77 | New Zealand | 75.8 |
| World Avg | 84.93 | |
| q=199. | ||
We have known for a long term that we must protect the environment from habitation destruction, over-exploitation, pollution, and the emissions that cause climate change. In 1998, Greenpeace wrote that "Environment can no longer be meaningfully separated from health, quality of life, democracy, education, economy or trade"14. What countries have been doing the right thing, via legislation and national culture? All countries' current and historical approach towards the environment is gauged via 21 datasets, including multiple decades of data on its forested percent change 2000-2020, its environmental performance, energy to GDP efficiency, its sign-up rate to major international accords on protecting the environment, the rate of rational beliefs on the environment in the population, reducing annual meat consumption per person and its score on the Green Future Index.
The countries that do the best (Sri Lanka, Uruguay and Switzerland) tend to have avoided the excesses of early industrial countries, and have not yet repeated the same mistakes of environmental destruction - at least, not on the same scale. The regions with the best average results per country are Central America, South America and Scandinavia. The worst are Eritrea, The Vatican City and Timor-Leste (E. Timor), and the worst regions Micronesia, Australasia and Melanesia.
For more, see:
2. Data Sets
2.1. Forest Area Change 2000-2020
#biodiversity #deforestation #environmentalism #forests #over-exploitation #the_environment
| Forest Area Change 2000-2020 Higher is better4 | ||
|---|---|---|
| Pos. | Total4 | |
| 1 | Guernsey | 82.6% |
| 2 | Bahrain | 75.2% |
| 3 | Iceland | 64.7% |
| ... | ||
| 9 | Kuwait | 28.9% |
| 10 | Uzbekistan | 23.3% |
| 11 | Algeria | 23.1% |
| 12 | China | 23.0% |
| 13 | Vietnam | 23.0% |
| 14 | Ireland | 22.8% |
| 15 | Syria | 20.0% |
| 16 | Guam | 16.7% |
| Asia Avg | 3.2% | |
| World Avg | -0.1% | |
| q=234. | ||
Forests are carbon sinks, mitigating against climate change15,16. Unfortunately, we are destroying over 70,000 km2 of forest each year17. In the last few thousand years, we've removed 30-40% of the Earth's forest cover18,16, mostly to clear space for agriculture, and for logging19,20. The produce from both is shipped from poorer countries to richer ones. Half-hearted government efforts and company obfuscation of supply chains makes it almost impossible for consumers to tell which foods and products are from sustainable sources, and which ones are encouraging irresponsible deforestation, meaning that there is little incentive for companies to relent.
The effects are catastrophic. 15% of all greenhouse gas emissions are the result of deforestation21,19. It brings soil erosion from wind and rain which, over time, can almost-permanently stop any hope of growing food22, and spreads desertification. Entire ecosystems are collapsing as a result, including ones that we depend upon23. The water cycle is driven by forests, and their loss reduces ordinary rainfall, increases flooding, removes an abundant source of water filtration, and contributes to a rise in water levels.24.
Some regions of the world are increasing their forest cover16; the best from 2000-2020 are Scandinavia (13.8% ), The Balkans (11.0% ) and Baltic States (7.6% )4. There is an overall trend that developed countries gathered their riches by using up their natural resources, and now, they pay poorer countries to use up theirs instead, whilst they can afford to slowly rebuild their natural environments. But it's not wholly that simple - some rich regions are still burning through what they've got. The regions clearing their forests fastest are Central America (-12.8% ), Africa (-9.1% ) and North America (-2.9% )4.
For more, see:
China has gained positive commendations for its epic effort to artificially bring parts of its ancient Taklamakan Desert to productive life, a 337 000 square-kilometre stretch of "relentless dunes, choking dust and extreme isolation"7. After a multiple-decade effort, large portions of the area are now green with life and are sites of large-scale carbon absorption. NASA's Orbiting Carbon Observatory (OCO) satellites have captured the faint near-infrared glow that occurs when plants photosynthesize when carbon dioxide is absorbed; "the gains are modest, but they are measurable"7. Atmospheric physicist King-Fai Li says that "this is not a rainforest [but] a shrubland like Southern California's chaparral. But the fact that it's drawing down CO2 at all, and doing it consistently, is something positive we can measure and verify from space"7.
Not including Taklamakan, from 2000 to 2010, China restored its forest cover by 13%, from 177 001 thousand hectares to 200 610 thousand; this was five times more than any other country's restoration in absolute hectares. It added a further 10% by 2020, in total setting an impressive precedent in Asia and for the world. That, however, is not the whole story.
 Many rich countries, including China, are increasing their forest cover whilst they import foods and goods that result from deforestation elsewhere. Tracing supply chains is difficult and supply firms obfuscate the chain of production so it's difficult to tell what products are to blame, and, some governments are particularly reluctant to fund investigations into the deforestation footprint of imports.
“Keiichiro Kanemoto and Nguyen Tien Hoang, of the Research Institute for Humanity and Nature in Japan, combined data on global forest loss with that on international trade between 2001 and 2015. They calculated that rich-country demand [...] contributed to a net loss of 20,000 square kilometres of forest in the rest of the world in 2015 alone.”
The Economist (2021)25
Of the worst countries, China's timber and rubber imports in particular "has helped to wipe out forests in Indochina"16 and the USA should take deforestation more seriously and re-engage in international efforts, as the negative effects of deforestation will affect us all, but cannot be handled well by countries working alone.
Averages by decade for China (for the ranks, lower is better):
| Forest Area Change 2000-2020 | 2000s Average | 2010s Average |
|---|---|---|
| China: | 13.3% | 9.7% |
| World Rank: | 14th | ⇡ 10th |
| World Avg: | 0.6% | -0.7% |
2.2. Environmental Performance
#climate_change #energy #sustainability #the_environment
| Environmental Performance Higher is better9 | ||
|---|---|---|
| Pos. | 20189 | |
| 1 | Switzerland | 87.4 |
| 2 | France | 84.0 |
| 3 | Denmark | 81.6 |
| ... | ||
| 117 | Zambia | 51.0 |
| 118 | Grenada | 50.9 |
| 119 | Tanzania | 50.8 |
| 120 | China | 50.7 |
| 121 | Thailand | 49.9 |
| 122 | Micronesia | 49.8 |
| 123 | Libya | 49.8 |
| 124 | Ghana | 49.7 |
| Asia Avg | 54.5 | |
| World Avg | 56.4 | |
| q=180. | ||
The Environmental Performance Index 2018 data includes 24 indicators including air pollution, water and sanitation, biodiversity, ecosystems and environmental health, combined into a single score by country, by the Yale University Center for Environmental Law & Policy.
China's emissions to wealth efficiency started out poor, but improvements in organisation and changes in culture meant that between the 1970s and the 1990s, it approached the global average:
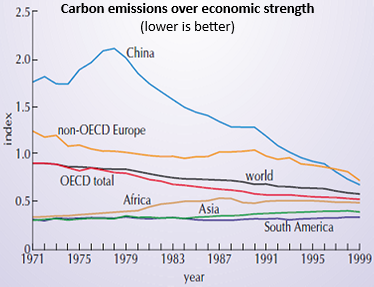
Source: Peake & Smith (2009)26
2.3. Energy to GDP Efficiency
#energy #sustainability #the_environment
| Energy to GDP Efficiency Lower is better10 | ||
|---|---|---|
| Pos. | 2022 Avg10 | |
| 1 | Rwanda | 0.25 |
| 2 | Chad | 0.26 |
| 3 | Tanzania | 0.31 |
| ... | ||
| 133 | S. Korea | 1.67 |
| 134 | Tajikistan | 1.67 |
| 135 | Mongolia | 1.68 |
| 136 | China | 1.68 |
| 137 | UAE | 1.73 |
| 138 | Zimbabwe | 1.74 |
| 139 | Saudi Arabia | 1.76 |
| 140 | Serbia | 1.79 |
| Asia Avg | 1.50 | |
| World Avg | 1.23 | |
| q=165. Also scored for 1960s-2010s. | ||
GDP per unit of energy consumption is often called 'Energy Intensity'. It's how efficient countries are at producing GDP in terms of primary energy use. It represents primary energy consumption using the substitution method, per unit of gross domestic product (GDP). A lower value means that less energy was used to maintain the country's GDP.
Averages by decade for China (for the ranks, lower is better):
| Energy to GDP Efficiency | 1960s Average | 1970s Average | 1980s Average | 1990s Average | 2000s Average | 2010s Average |
|---|---|---|---|---|---|---|
| China: | 1.72 | 2.51 | 2.31 | 2.21 | 2.25 | 1.98 |
| World Rank: | 34th | ⇣ 47th | ⇣ 107th | ⇣ 108th | ⇣ 131st | ⇣ 140th |
| World Avg: | 2.05 | 2.13 | 2.10 | 2.15 | 1.60 | 1.30 |
2.4. International Accords on the Environment
#environmentalism #internationalism
| International Accords on the Environment Higher is better | ||
|---|---|---|
| Pos. | Total Avg Rate | |
| 1 | Sweden | 83% |
| 2 | Canada | 82% |
| 3 | Norway | 81% |
| ... | ||
| 61 | Congo, DR | 65% |
| 62 | Sri Lanka | 65% |
| 63 | Madagascar | 65% |
| 64 | China | 64% |
| 65 | Malaysia | 64% |
| 66 | Botswana | 64% |
| 67 | El Salvador | 64% |
| 68 | Iran | 64% |
| Asia Avg | 55.4% | |
| World Avg | 57.5% | |
| q=197. Also scored for 1970s-2020s. | ||
Each country is scored using a formula that takes the date each country took up major international environmental agreements, as a ratio of maximum possible days. The agreements covered are: (1) the Basel Convention on the Control of Transboundary Movements of Hazardous Wastes and their Disposal, (2) the Rotterdam Convention on the Prior Informed Consent Procedure for certain hazardous Chemicals and Pesticides, (3) the Stockholm Convention on Persistent Organic Pollutants, (4) the Waigani Convention (for those countries that are eligible), (5) the Convention on Biological Diversity (CBD), (6) the Kyoto Protocol and (7) its successor, the Paris Agreement, (8) the Convention on International Trade in Endangered Species of Wild Fauna and Flora (CITES), (9) the Montreal Protocol on Substances that Deplete the Ozone Layer and finally, (10) the Vienna Convention for the Protection of the Ozone Layer.
For more, see:
Averages by decade for China (for the ranks, lower is better):
| International Accords on the Environment | 1970s Average | 1980s Average | 1990s Average | 2000s Average | 2010s Average | 2020s Average |
|---|---|---|---|---|---|---|
| China: | 0% | 32% | 69% | 85% | 99% | 100% |
| World Rank: | 52nd | ⇣ 73rd | ⇡ 11th | ⇣ 49th | ⇡ 8th | ⇡ 1st |
| World Avg: | 8.5% | 23.3% | 45.0% | 74.4% | 90.7% | 95.0% |
2.5. Rational Beliefs on the Environment
| Rational Beliefs on the Environment Higher is better11 | ||
|---|---|---|
| Pos. | 2011 %11 | |
| 1 | Argentina | 78.3% |
| 2 | Greece | 77.6% |
| 3 | Brazil | 77.1% |
| ... | ||
| 134 | Tunisia | 19.3% |
| 135 | Czechia | 16.0% |
| 136 | Estonia | 15.9% |
| 137 | China | 15.1% |
| 138 | Denmark | 14.9% |
| 139 | Libya | 14.6% |
| 140 | Iceland | 13.1% |
| 141 | Uzbekistan | 11.3% |
| Asia Avg | 37.9% | |
| World Avg | 39.9% | |
| q=145. | ||
2.6. Meat Consumption
#animal_rights #animal_welfare #diet #food #health #meat #veganism #vegetarianism
| Meat Consumption Lower is better8 | ||
|---|---|---|
| Pos. | 2021 kg8 | |
| 1 | Congo, DR | 03.0 |
| 2 | Burundi | 03.5 |
| 3 | Bangladesh | 04.3 |
| ... | ||
| 108 | Bulgaria | 61.8 |
| 109 | Moldova | 61.9 |
| 110 | Costa Rica | 62.2 |
| 111 | China | 63.6 |
| 112 | Uruguay | 62.8 |
| 113 | Jamaica | 63.4 |
| 114 | Slovakia | 63.5 |
| 115 | China | 63.6 |
| Asia Avg | 46.7 | |
| World Avg | 52.5 | |
| q=185. Also scored for 2010s. | ||
There are six key arguments in favour of vegetarianism which accrue even from partial adoption: (1) Vegetarian diets have notable health advantages over carnivorous diets, especially for heart and cardiovascular issues28,29,30. (2) It is morally better to avoid killing or harming animals. (3) Plant-based diets use much less water than carnivorous ones, to the extent that agricultural and water management scientists urge governments to encourage people to switch31. (4) Vegetarian food production uses substantially less land28,32,33. (5) Growing vegetables for direct consumption is more efficient than using them to raise animals for meat in terms of resources, time and nutrition (including proteins). And, (6) vegetarianism is better for the environment than meat-production for emissions, sewerage, pollution and chemicals usage.28,32. A plant-based diet causes 75% less greenhouse gas emissions than a typical carnivorous diet33. The global food industry causes about 1/3 of all planet-heating emissions, and so "to slow the worst climate effects, the United Nations has called for a drastic reduction in meat consumption"33. Despite this, "reducing appetites for carbon-intensive meat and dairy is incredibly hard"34 and as countries get richer, they tend to eat more meat.
On average throughout the 2010s, China's rate was 60.6.
2.7. Green Future Index
#climate_change #energy #sustainability #the_environment
| Green Future Index Higher is better5 | ||
|---|---|---|
| Pos. | 2023 Score5 | |
| 1 | Iceland | 6.7 |
| 2 | Finland | 6.7 |
| 3 | Norway | 6.4 |
| ... | ||
| 24 | Costa Rica | 5.3 |
| 25 | S. Africa | 5.2 |
| 26 | Uruguay | 5.1 |
| 27 | China | 5.1 |
| 28 | Japan | 5.1 |
| 29 | Hungary | 5.1 |
| 30 | Chile | 5.1 |
| 31 | Czechia | 5.0 |
| Asia Avg | 4.3 | |
| World Avg | 4.8 | |
| q=76. | ||
The Green Futures Index (GFI) has been running since 2021, and looks at 23 data sets for over 70 countries, with a focus on effectiveness, policy and planning 'for a low carbon future. It is complementary to existing goals and frameworks for sustainable development'. Datasets include qualitative appraisals and quantitative measurements on carbon emissions across multiple sectors, renewable and nuclear energy, recycling capabilities, green technologies used in building and construction, transport, scientific and industrial green innovations and patent quantities, climate action and climate policies. Each country is then ranked by their final score.35.
The 2023 edition of the Green Futures Index found that China's nuclear energy production growth has recently been higher than any of the other countries it reviewed (except Japan and Pakistan), helping its transition towards sustainability.35