Belgium's Responsibility Towards The Environment
https://www.humantruth.info/belgium_environment.html
By Vexen Crabtree 2026
#Belgium #belgium_and_the_environment #Belgium_environment #climate_change #energy #sustainability #the_environment
| Belgium Kingdom of Belgium [Country Profile Page] |  |
|---|---|
| Status | Independent State |
| Social and Moral Index | 8th best |
| Capital | Brussels |
| Land Area | 30 280km21 |
| Location | Europe |
| Population | 11.5m2 |
| Life Expectancy | 81.88yrs (2017)3 |
| GNI | $52 293 (2017)4 |
| ISO3166-1 Codes | BE, BEL, 565 |
| Internet Domain | .be6 |
| Currency | Euro (EUR)7 |
| Telephone | +328 |
In terms of its responsibility towards the environment, Belgium ranks 74th in the world. This is calculated from 21 data sets. Belgium comes in the best 20 in its score on the Green Future Index9 and in its environmental performance10. It does better than average in its sign-up rate to major international accords on protecting the environment and in its forested percent change 2000-202011. But, there's bad news too. Belgium does worse than average in the rate of rational beliefs on the environment in the population12, reducing annual meat consumption per person13 (still low for Europe) and in energy to GDP efficiency14.
1. Belgium's Responsibility Towards The Environment
#climate_change #the_environment
| Compared to Europe (2025)15 | ||
|---|---|---|
| Pos. | Lower is better Avg Rank15 | |
| 1 | Switzerland | 45.0 |
| 2 | Denmark | 50.4 |
| 3 | Liechtenstein | 56.8 |
| ... | ||
| 19 | Romania | 73.8 |
| 20 | UK | 74.4 |
| 21 | Turkey | 75.0 |
| 22 | Belgium | 75.3 |
| 23 | Bulgaria | 75.8 |
| 24 | Latvia | 77.7 |
| 25 | Slovakia | 80.8 |
| 26 | Poland | 81.0 |
| 27 | Slovenia | 82.1 |
| Europe Avg | 82.54 | |
| q=48. | ||
| Responsibility Towards The Environment (2025)15 | ||
|---|---|---|
| Pos. | Lower is better Avg Rank15 | |
| 1 | Sri Lanka | 34.9 |
| 2 | Uruguay | 43.2 |
| 3 | Switzerland | 45.0 |
| ... | ||
| 71 | UK | 74.4 |
| 72 | Turkey | 75.0 |
| 73 | China | 75.2 |
| 74 | Belgium | 75.3 |
| 75 | Cape Verde | 75.6 |
| 76 | Afghanistan | 75.7 |
| 77 | New Zealand | 75.8 |
| 78 | Bulgaria | 75.8 |
| World Avg | 84.93 | |
| q=199. | ||
We have known for a long term that we must protect the environment from habitation destruction, over-exploitation, pollution, and the emissions that cause climate change. In 1998, Greenpeace wrote that "Environment can no longer be meaningfully separated from health, quality of life, democracy, education, economy or trade"16. What countries have been doing the right thing, via legislation and national culture? All countries' current and historical approach towards the environment is gauged via 21 datasets, including multiple decades of data on its forested percent change 2000-2020, its environmental performance, energy to GDP efficiency, its sign-up rate to major international accords on protecting the environment, the rate of rational beliefs on the environment in the population, reducing annual meat consumption per person and its score on the Green Future Index.
The countries that do the best (Sri Lanka, Uruguay and Switzerland) tend to have avoided the excesses of early industrial countries, and have not yet repeated the same mistakes of environmental destruction - at least, not on the same scale. The regions with the best average results per country are Central America, South America and Scandinavia. The worst are Eritrea, The Vatican City and Timor-Leste (E. Timor), and the worst regions Micronesia, Australasia and Melanesia.
For more, see:
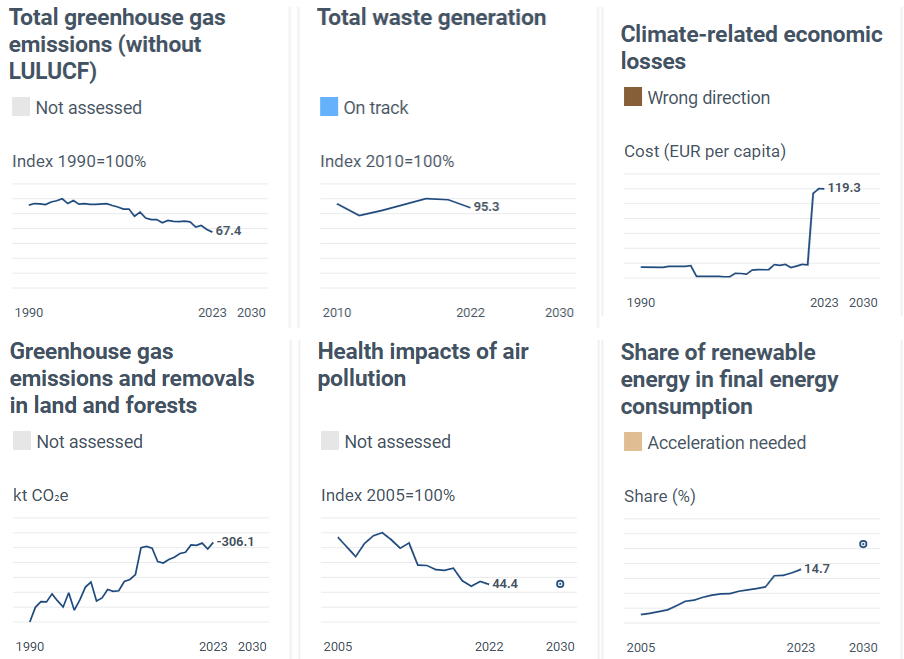
Belgian is one of those many rich countries who struggle with high resource usage, but nonetheless, things are generally going in the correct direction - just slowly. Here's some graphs extract from the European Environment Agency's page on Belgium17. With ongoing rollout of low-emission zones, many people are experiencing significantly better air pollution and over the past 20 years, the % of consumed energy from renewable sources has increased to 15%.
2. Data Sets
2.1. Forest Area Change 2000-2020
#biodiversity #deforestation #environmentalism #forests #over-exploitation #the_environment
| Forest Area Change 2000-2020 Higher is better11 | ||
|---|---|---|
| Pos. | Total11 | |
| 1 | Guernsey | 82.6% |
| 2 | Bahrain | 75.2% |
| 3 | Iceland | 64.7% |
| ... | ||
| 58 | Bosnia & Herzegovina | 3.6% |
| 59 | Djibouti | 3.6% |
| 60 | Tajikistan | 3.4% |
| 61 | Belgium | 3.3% |
| 62 | Croatia | 2.9% |
| 63 | Netherlands | 2.8% |
| 64 | UAE | 2.5% |
| 65 | Albania | 2.5% |
| Europe Avg | 8.2% | |
| World Avg | -0.1% | |
| q=234. | ||
Forests are carbon sinks, mitigating against climate change18,19. Unfortunately, we are destroying over 70,000 km2 of forest each year20. In the last few thousand years, we've removed 30-40% of the Earth's forest cover21,19, mostly to clear space for agriculture, and for logging22,23. The produce from both is shipped from poorer countries to richer ones. Half-hearted government efforts and company obfuscation of supply chains makes it almost impossible for consumers to tell which foods and products are from sustainable sources, and which ones are encouraging irresponsible deforestation, meaning that there is little incentive for companies to relent.
The effects are catastrophic. 15% of all greenhouse gas emissions are the result of deforestation24,22. It brings soil erosion from wind and rain which, over time, can almost-permanently stop any hope of growing food25, and spreads desertification. Entire ecosystems are collapsing as a result, including ones that we depend upon26. The water cycle is driven by forests, and their loss reduces ordinary rainfall, increases flooding, removes an abundant source of water filtration, and contributes to a rise in water levels.27.
Some regions of the world are increasing their forest cover19; the best from 2000-2020 are Scandinavia (13.8% ), The Balkans (11.0% ) and Baltic States (7.6% )11. There is an overall trend that developed countries gathered their riches by using up their natural resources, and now, they pay poorer countries to use up theirs instead, whilst they can afford to slowly rebuild their natural environments. But it's not wholly that simple - some rich regions are still burning through what they've got. The regions clearing their forests fastest are Central America (-12.8% ), Africa (-9.1% ) and North America (-2.9% )11.
For more, see:
Averages by decade for Belgium (for the ranks, lower is better):
| Forest Area Change 2000-2020 | 2000s Average | 2010s Average |
|---|---|---|
| Belgium: | 3.4% | -0.1% |
| World Rank: | 43rd | ⇣ 145th |
| World Avg: | 0.6% | -0.7% |
2.2. Environmental Performance
#climate_change #energy #sustainability #the_environment
| Environmental Performance Higher is better10 | ||
|---|---|---|
| Pos. | 201810 | |
| 1 | Switzerland | 87.4 |
| 2 | France | 84.0 |
| 3 | Denmark | 81.6 |
| ... | ||
| 12 | Spain | 78.4 |
| 13 | Germany | 78.4 |
| 14 | Norway | 77.5 |
| 15 | Belgium | 77.4 |
| 16 | Italy | 77.0 |
| 17 | New Zealand | 76.0 |
| 18 | Netherlands | 75.5 |
| 19 | Israel | 75.0 |
| Europe Avg | 69.6 | |
| World Avg | 56.4 | |
| q=180. | ||
The Environmental Performance Index 2018 data includes 24 indicators including air pollution, water and sanitation, biodiversity, ecosystems and environmental health, combined into a single score by country, by the Yale University Center for Environmental Law & Policy.
2.3. Energy to GDP Efficiency
#energy #sustainability #the_environment
| Energy to GDP Efficiency Lower is better14 | ||
|---|---|---|
| Pos. | 2022 Avg14 | |
| 1 | Rwanda | 0.25 |
| 2 | Chad | 0.26 |
| 3 | Tanzania | 0.31 |
| ... | ||
| 118 | Armenia | 1.42 |
| 119 | Finland | 1.44 |
| 120 | Qatar | 1.46 |
| 121 | Belgium | 1.49 |
| 122 | Panama | 1.49 |
| 123 | Uzbekistan | 1.52 |
| 124 | Malaysia | 1.53 |
| 125 | Vietnam | 1.55 |
| Europe Avg | 1.25 | |
| World Avg | 1.23 | |
| q=165. Also scored per decade 1960s-2010s. | ||
GDP per unit of energy consumption is often called 'Energy Intensity'. It's how efficient countries are at producing GDP in terms of primary energy use. It represents primary energy consumption using the substitution method, per unit of gross domestic product (GDP). A lower value means that less energy was used to maintain the country's GDP.
Averages by decade for Belgium (for the ranks, lower is better):
| Energy to GDP Efficiency | 1960s Average | 1970s Average | 1980s Average | 1990s Average | 2000s Average | 2010s Average |
|---|---|---|---|---|---|---|
| Belgium: | 3.16 | 2.89 | 2.32 | 2.28 | 2.00 | 1.61 |
| World Rank: | 52nd | 52nd | ⇣ 108th | ⇣ 112th | ⇣ 124th | ⇡ 123rd |
| World Avg: | 2.05 | 2.13 | 2.10 | 2.15 | 1.60 | 1.30 |
2.4. International Accords on the Environment
#environmentalism #internationalism
| International Accords on the Environment Higher is better | ||
|---|---|---|
| Pos. | International Accords on the Environment Avg Rate | |
| 1 | Sweden | 83% |
| 2 | Canada | 82% |
| 3 | Norway | 81% |
| ... | ||
| 54 | New Zealand | 66% |
| 55 | Spain | 66% |
| 56 | Guatemala | 66% |
| 57 | Belgium | 66% |
| 58 | Papua New Guinea | 66% |
| 59 | Italy | 66% |
| 60 | Morocco | 66% |
| 61 | Congo, DR | 65% |
| Europe Avg | 62.7% | |
| World Avg | 57.5% | |
| q=197. Also scored per decade 1970s-2020s. | ||
Each country is scored using a formula that takes the date each country took up major international environmental agreements, as a ratio of maximum possible days. The agreements covered are: (1) the Basel Convention on the Control of Transboundary Movements of Hazardous Wastes and their Disposal, (2) the Rotterdam Convention on the Prior Informed Consent Procedure for certain hazardous Chemicals and Pesticides, (3) the Stockholm Convention on Persistent Organic Pollutants, (4) the Waigani Convention (for those countries that are eligible), (5) the Convention on Biological Diversity (CBD), (6) the Kyoto Protocol and (7) its successor, the Paris Agreement, (8) the Convention on International Trade in Endangered Species of Wild Fauna and Flora (CITES), (9) the Montreal Protocol on Substances that Deplete the Ozone Layer and finally, (10) the Vienna Convention for the Protection of the Ozone Layer.
For more, see:
Belgium was amongst the first batch of countries who signed the Montreal Protocol on protecting the Ozone layer in 1988 whilst most others delayed until subsequent years.“Belgium aims to reach climate neutrality by 2050 (see trajectory in Figure 1). In 2023, Belgium accounted for 3.5% of the EU's net greenhouse gas (GHG) emissions and reduced its net emissions by 29.3% between 2005 and 2023, just below the EU average reduction of 30.5% over the same period. Also during that period, the country reduced emissions covered by the EU emissions trading system (ETS) by 46.7%. Belgium's land use, land-use change and forestry (LULUCF) sector has consistently performed as a small carbon sink.”
EU 2023 Climate Action Strategy28
Averages by decade for Belgium (for the ranks, lower is better):
| International Accords on the Environment | 1970s Average | 1980s Average | 1990s Average | 2000s Average | 2010s Average | 2020s Average |
|---|---|---|---|---|---|---|
| Belgium: | 0% | 50% | 61% | 86% | 97% | 100% |
| World Rank: | 52nd | ⇡ 27th | ⇣ 53rd | ⇡ 43rd | ⇣ 85th | ⇡ 1st |
| World Avg: | 8.5% | 23.3% | 45.0% | 74.4% | 90.7% | 95.0% |
2.5. Rational Beliefs on the Environment
| Rational Beliefs on the Environment Higher is better12 | ||
|---|---|---|
| Pos. | 2011 %12 | |
| 1 | Argentina | 78.3% |
| 2 | Greece | 77.6% |
| 3 | Brazil | 77.1% |
| ... | ||
| 100 | Israel | 27.6% |
| 101 | Palestine | 27.5% |
| 102 | Saudi Arabia | 27.2% |
| 103 | Belgium | 26.9% |
| 104 | Syria | 26.6% |
| 105 | Qatar | 26.5% |
| 106 | Bahrain | 26.3% |
| 107 | S. Africa | 26.2% |
| Europe Avg | 33.6% | |
| World Avg | 39.9% | |
| q=145. | ||
2.6. Meat Consumption
#animal_rights #animal_welfare #diet #food #health #meat #veganism #vegetarianism
| Meat Consumption Lower is better13 | ||
|---|---|---|
| Pos. | 2021 kg13 | |
| 1 | Congo, DR | 03.0 |
| 2 | Burundi | 03.5 |
| 3 | Bangladesh | 04.3 |
| ... | ||
| 115 | China | 63.6 |
| 116 | Netherlands | 63.8 |
| 117 | Malaysia | 65.3 |
| 118 | Belgium | 66.2 |
| 119 | Gabon | 66.3 |
| 120 | Sweden | 66.9 |
| 121 | Romania | 67.1 |
| 122 | Malta | 67.8 |
| Europe Avg | 71.1 | |
| World Avg | 52.5 | |
| q=185. Also scored per decade 2010s. | ||
There are six key arguments in favour of vegetarianism which accrue even from partial adoption: (1) Vegetarian diets have notable health advantages over carnivorous diets, especially for heart and cardiovascular issues29,30,31. (2) It is morally better to avoid killing or harming animals. (3) Plant-based diets use much less water than carnivorous ones, to the extent that agricultural and water management scientists urge governments to encourage people to switch32. (4) Vegetarian food production uses substantially less land29,33,34. (5) Growing vegetables for direct consumption is more efficient than using them to raise animals for meat in terms of resources, time and nutrition (including proteins). And, (6) vegetarianism is better for the environment than meat-production for emissions, sewerage, pollution and chemicals usage.29,33. A plant-based diet causes 75% less greenhouse gas emissions than a typical carnivorous diet34. The global food industry causes about 1/3 of all planet-heating emissions, and so "to slow the worst climate effects, the United Nations has called for a drastic reduction in meat consumption"34. Despite this, "reducing appetites for carbon-intensive meat and dairy is incredibly hard"35 and as countries get richer, they tend to eat more meat.
In the 2010s, meat consumption per person in Belgium was reducing.13
On average throughout the 2010s, Belgium's rate was 63.6.
2.7. Green Future Index
#climate_change #energy #sustainability #the_environment
| Green Future Index Higher is better9 | ||
|---|---|---|
| Pos. | 2023 Score9 | |
| 1 | Iceland | 6.7 |
| 2 | Finland | 6.7 |
| 3 | Norway | 6.4 |
| ... | ||
| 9 | France | 6.0 |
| 10= | Spain | 5.9 |
| 10= | Germany | 5.9 |
| 12 | Belgium | 5.8 |
| 13 | Italy | 5.7 |
| 14= | Ireland | 5.7 |
| 14= | Canada | 5.7 |
| 16 | Luxembourg | 5.6 |
| Europe Avg | 5.6 | |
| World Avg | 4.8 | |
| q=76. | ||
The Green Futures Index (GFI) has been running since 2021, and looks at 23 data sets for over 70 countries, with a focus on effectiveness, policy and planning 'for a low carbon future. It is complementary to existing goals and frameworks for sustainable development'. Datasets include qualitative appraisals and quantitative measurements on carbon emissions across multiple sectors, renewable and nuclear energy, recycling capabilities, green technologies used in building and construction, transport, scientific and industrial green innovations and patent quantities, climate action and climate policies. Each country is then ranked by their final score.36.